How to Use Analyst Quadrant Reports as an Enterprise IGA Buyer in 2026
Analyst quadrant reports are the most-cited and most-misread artifact in enterprise IGA procurement. The 2026 buyer-side guide on how vendor quadrant placement actually maps to deployment risk, where the methodology blind spots are, and how to use the report alongside the operational evidence procurement teams actually need.
Analyst quadrant reports are the most-cited and most-misread procurement artifact in enterprise identity governance and administration. The annual IGA reports from major analyst firms reach hundreds of thousands of enterprise buyers — every CISO and CIO reads them, every procurement team uses them in shortlist defense, every board deck references them. The reports do real work. They identify the vendor field, summarize the competitive landscape, and provide procurement-defensible evidence of due diligence. They also have methodology blind spots that experienced IGA buyers have learned to read around.
This piece is the buyer-side reading guide. The objective is not to argue against the analyst reports — they are valuable inputs — but to put them in the right place in the procurement evidence stack and call out the blind spots that operationally bite IGA deployments. The companion piece Best IGA Solutions covers the vendor landscape comparison; the companion Best ILM Solutions covers the lifecycle layer; the Selecting the Right Identity Vendor piece covers the broader procurement architecture. This piece is the analyst-report-specific layer that runs above all three.
What analyst quadrant placement actually measures
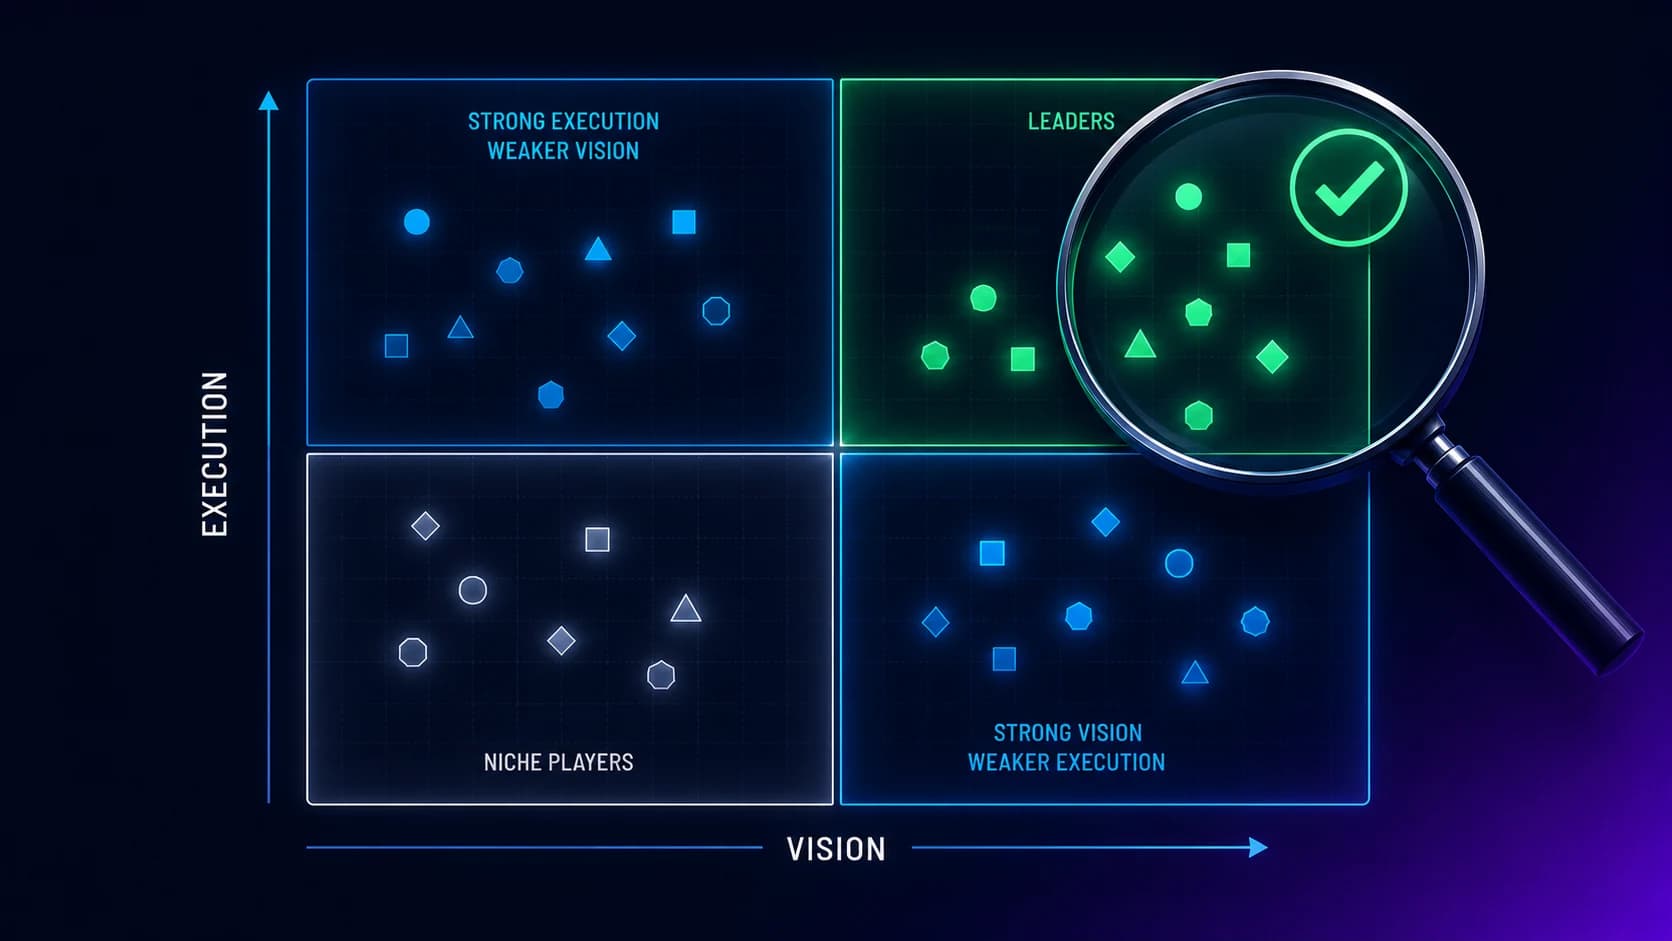
Analyst quadrant reports plot vendors on a two-axis grid. The conventional axes are "completeness of vision" (horizontal) and "ability to execute" (vertical) — the labels vary slightly between firms but the underlying intent is consistent. Vendors fall into four zones based on where they land on the grid: Leaders (top-right, high on both), Challengers (top-left, high execution with developing vision), Visionaries (bottom-right, strong vision with developing execution), and Niche Players (bottom-left, focused or emerging on both axes).
The "completeness of vision" axis measures how thoroughly the vendor's product roadmap, market positioning, and strategic narrative align with where the analyst firm thinks the category is going. It is forward-looking and reflects the analyst's view of the market's trajectory. A vendor scores high on vision by having a clear, well-articulated, comprehensive product strategy that maps to emerging buyer needs. The axis is necessarily judgment-laden — different analyst firms reach different conclusions about where the category is going, and a vendor's vision score can change substantially between firms in the same year.
The "ability to execute" axis measures how effectively the vendor delivers on its current product portfolio. The factors include product capability today, service and support quality, customer experience, financial viability, sales execution, and operational track record. The axis is more backward-looking — it reflects what the vendor has actually shipped and how well customers have experienced the deployment.
The placement is not a single score. It is the analyst firm's read of the vendor's position on both axes after a structured evaluation that includes vendor surveys, reference customer interviews, product demonstrations, and the analyst's own market intelligence. The methodology is generally well-documented and the same vendor evaluated by different analyst firms in the same year often ends up in different quadrant zones, which is informative about the limits of any single firm's read.
The strategic point for a buyer is that placement reflects market positioning, not deployment fit. A Leader-quadrant vendor has been validated as having a complete product vision and strong execution. It has not been validated as the right fit for your specific workforce, your specific regulatory environment, or your specific deployment timeline.
 The labels were not designed as buyer recommendations. Leader doesn't mean right-for-you; Niche doesn't mean limited. The buyer-side reading is about deployment fit, not market positioning.
The four quadrants, read by an enterprise buyer
The conventional reading of the four quadrants is well-known. The buyer-side reading is different in load-bearing ways.
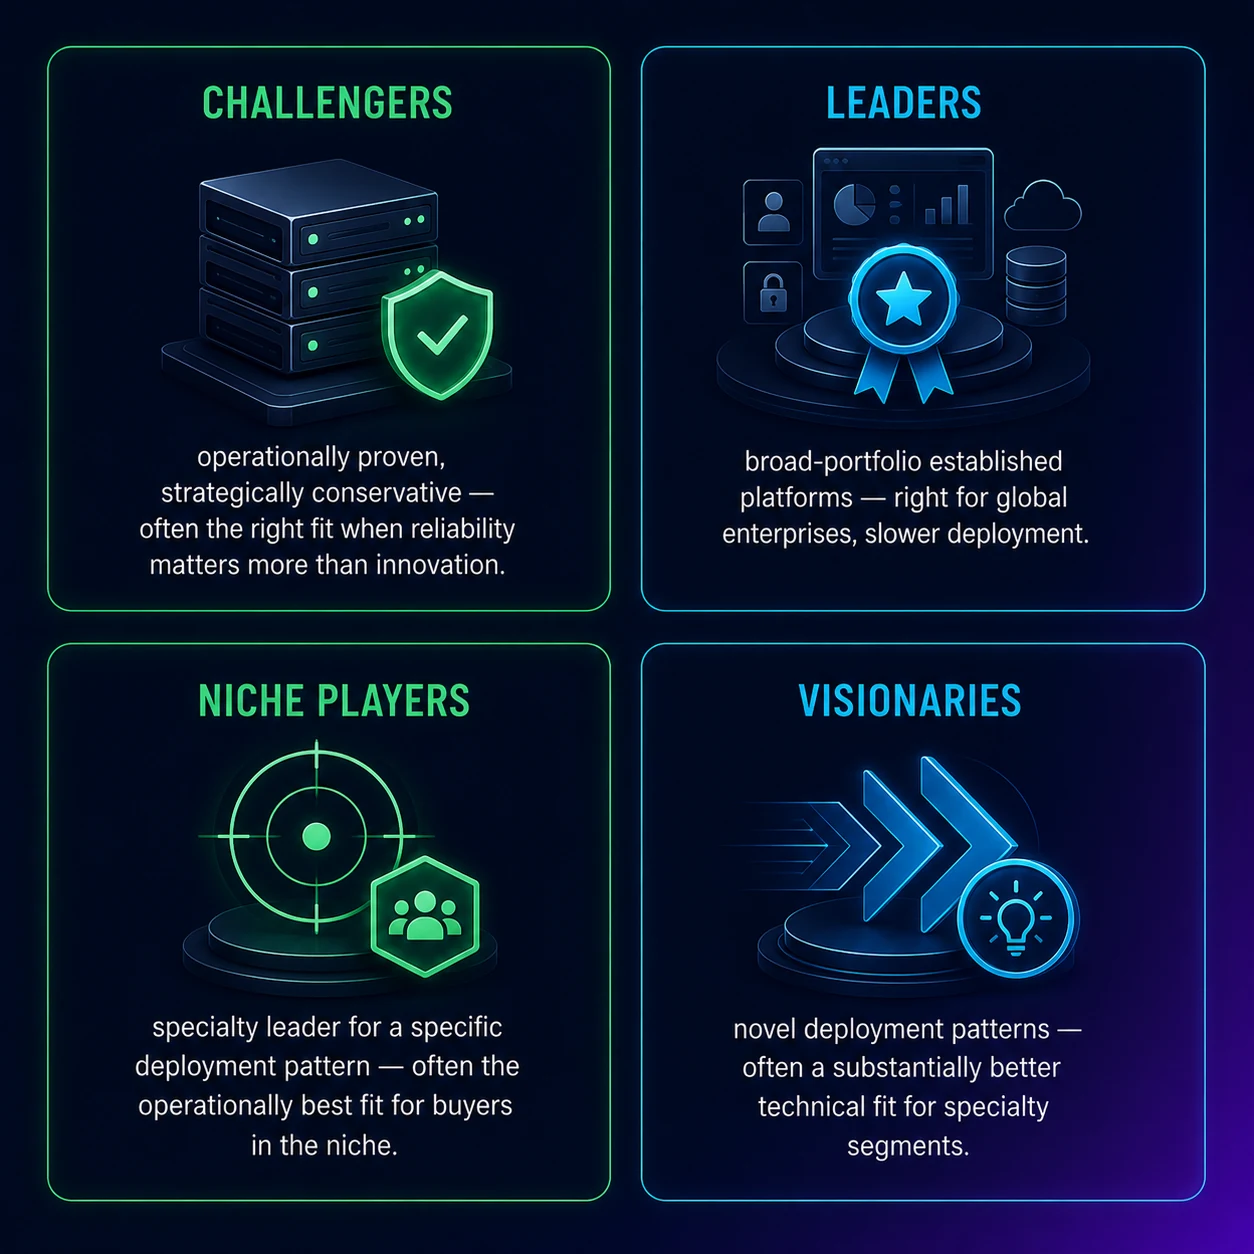
Leaders. Leader-quadrant vendors are typically larger enterprises with broad product portfolios, established market presence, and substantial customer bases. They are the right fit for buyers who want established platforms with broad capability, who are prepared to accept longer deployment timelines in exchange for portfolio breadth, and whose procurement processes favor lower vendor risk. The blind spot for buyers is that Leader placement does not guarantee operational fit — many Leader vendors have weak or no native mainframe connectivity, undercount frontline shared-workstation deployments, and have long implementation cycles that don't fit mid-market deployment economics. The leader vendor that is right for a Fortune 50 global manufacturer is often the wrong vendor for a 5,000-employee healthcare network.
Challengers. Challenger-quadrant vendors score high on execution but lower on vision. The conventional reading is that they are operationally strong but strategically uncertain. The buyer-side reading is more nuanced: many Challenger vendors are large established platforms that have matured into stable execution but whose product strategy is in transition (often due to acquisitions, platform consolidation, or evolving market positioning). The Challenger quadrant frequently contains vendors that are operationally excellent but strategically conservative — which can be exactly the right fit for an enterprise that needs reliability over innovation. The blind spot is that the Challenger label sounds negative ("not yet a Leader") when it often actually means "operationally proven, strategically steady."
Visionaries. Visionary-quadrant vendors score high on vision but lower on execution. The conventional reading is that they have interesting product strategy but are not yet operationally mature. The buyer-side reading recognizes that Visionary placement often reflects a vendor that is doing something genuinely novel — addressing a market segment the Leaders haven't entered, building a deployment pattern the Leaders can't replicate, or solving an operational problem the Leaders have ignored. For buyers whose deployment fit aligns with the Visionary's niche, the technical match is often substantially better than any Leader. The blind spot is that the Visionary label sounds risky ("not yet operationally mature") when it often actually means "operationally focused on the segment that matters to a subset of buyers."
Niche Players. Niche-quadrant vendors are positioned in specific segments or are emerging on both axes. The conventional reading is that they have limited applicability. The buyer-side reading is that "Niche" frequently means "specialty leader for a specific deployment pattern" — mainframe-focused vendors, mid-market-focused vendors, vertical-industry-focused vendors (healthcare, financial services, government). For buyers whose deployment falls into the niche, the Niche vendor often ships a substantially better fit than a generalist Leader. The blind spot is that "Niche" sounds dismissive when it often actually means "operationally optimized for a specific buyer profile."
The pattern across all four quadrants is the same: the placement labels were not designed as buyer recommendations. They are market-positioning summaries. The buyer who reads the labels as recommendations ("buy from Leaders") gets a procurement-defensible result that frequently doesn't match the operational deployment.
 Five dimensions where the analyst rubric systematically under-represents reality. Experienced buyers learn to compensate by pairing the report with the operational evidence the methodology doesn't capture.
The methodology blind spots that bite IGA deployments
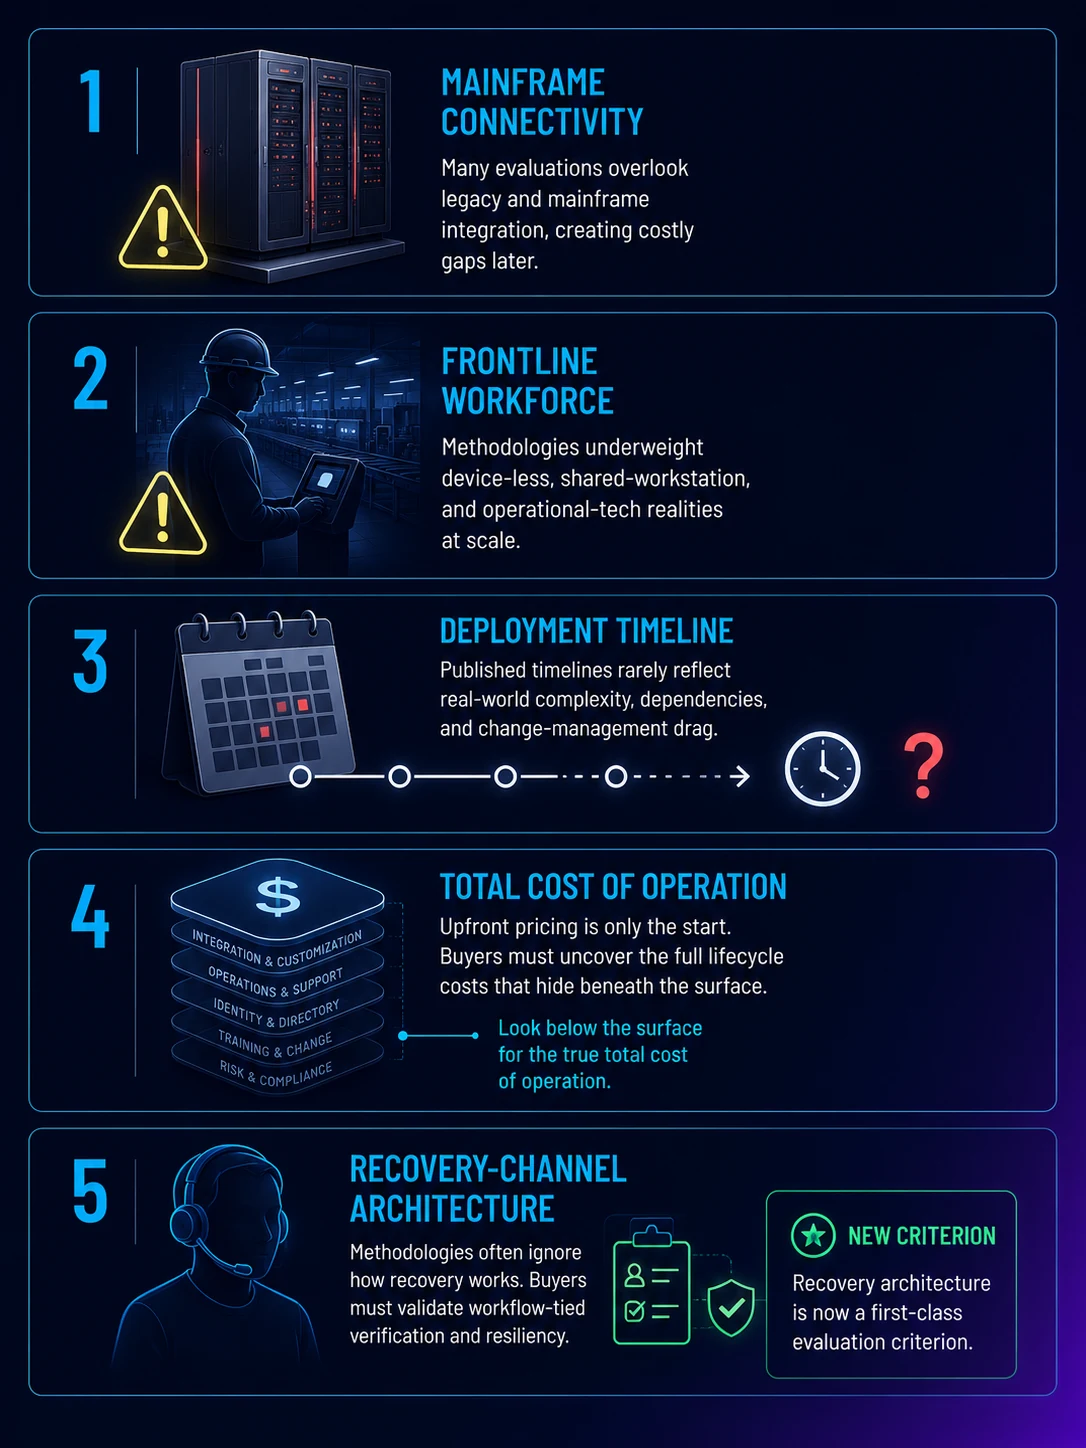
Enterprise IGA deployments have five operational dimensions where the standard analyst methodology systematically under-represents reality. Experienced buyers learn to compensate.
Mainframe and legacy-system connectivity. Many enterprises that deploy IGA have substantial RACF, ACF2, Top Secret, AS400/iSeries, and legacy-application environments that need to be governed alongside the modern stack. The analyst reports tend to undercount native mainframe connectivity — partly because the analyst firms' product evaluations are biased toward the modern stack, partly because the demo environments don't include mainframe scenarios, partly because the analyst evaluation rubrics weight the modern integration patterns more than the mainframe patterns. Buyers with significant mainframe estates should treat the analyst placement as preliminary evidence only and validate mainframe coverage through direct vendor demos against their specific mainframe stack. The companion RACF vs ACF2 piece covers the mainframe-side architecture this depends on.
Service-desk and frontline workforce coverage. Many enterprises have substantial frontline workforces — manufacturing, retail, healthcare clinical, defense, hospitality — that are governed through different patterns than knowledge workers. Shared workstations, kiosk access, badge-based authentication, service-desk-driven account lifecycle. The analyst rubrics historically undercount frontline scenarios because the evaluation methodology is biased toward managed-device knowledge-worker deployments. Buyers with significant frontline populations should validate the frontline-specific coverage through direct demos.
Deployment timeline reality versus capability matrix. Analyst reports describe what vendors can do, not how long it takes to do it. A vendor that ships 50 native connectors and a comprehensive workflow engine looks capable on the matrix; whether that vendor's implementation completes in 6 months or 24 months for a typical mid-market deployment is a different question the analyst report doesn't answer. Reference customer conversations with operationally similar enterprises are the primary source for deployment-timeline evidence. The analyst report does not provide this signal.
Total cost of operation versus license cost. The analyst rubrics include some cost signals, but the signals usually reflect list price for the vendor's named capabilities. The reality of IGA TCO is dominated by implementation services, integration work, customization, training, ongoing administration headcount, and the soft cost of organizational change management. The license cost is often 30-40% of three-year TCO; the implementation and operational cost is the remainder. Buyers who select on license cost get blindsided by implementation. Procurement-led TCO modeling that includes the full cost stack is the complementary evidence the analyst report doesn't provide.
Service-desk verification and recovery-channel architecture. This is the methodology gap that has gotten more consequential with the rise of Storm-2949-style social-engineering attacks. The analyst rubrics evaluate IGA capabilities in terms of access certification, role management, segregation of duties, and provisioning workflows. They less consistently evaluate the recovery-channel architecture — what happens when a user calls the help desk and asks for a password reset or credential re-enrollment. Buyers in the post-Storm-2949 threat model should treat service-desk verification as a first-class evaluation criterion regardless of how the analyst report scores it. The Storm-2949 governance failure analysis piece covers the architectural pattern this implies.
 Four evidence sources working together. The analyst report does its job of identifying the field and providing market context; the other three sources fill the operational evidence gap analyst summaries cannot.
What complementary procurement evidence looks like
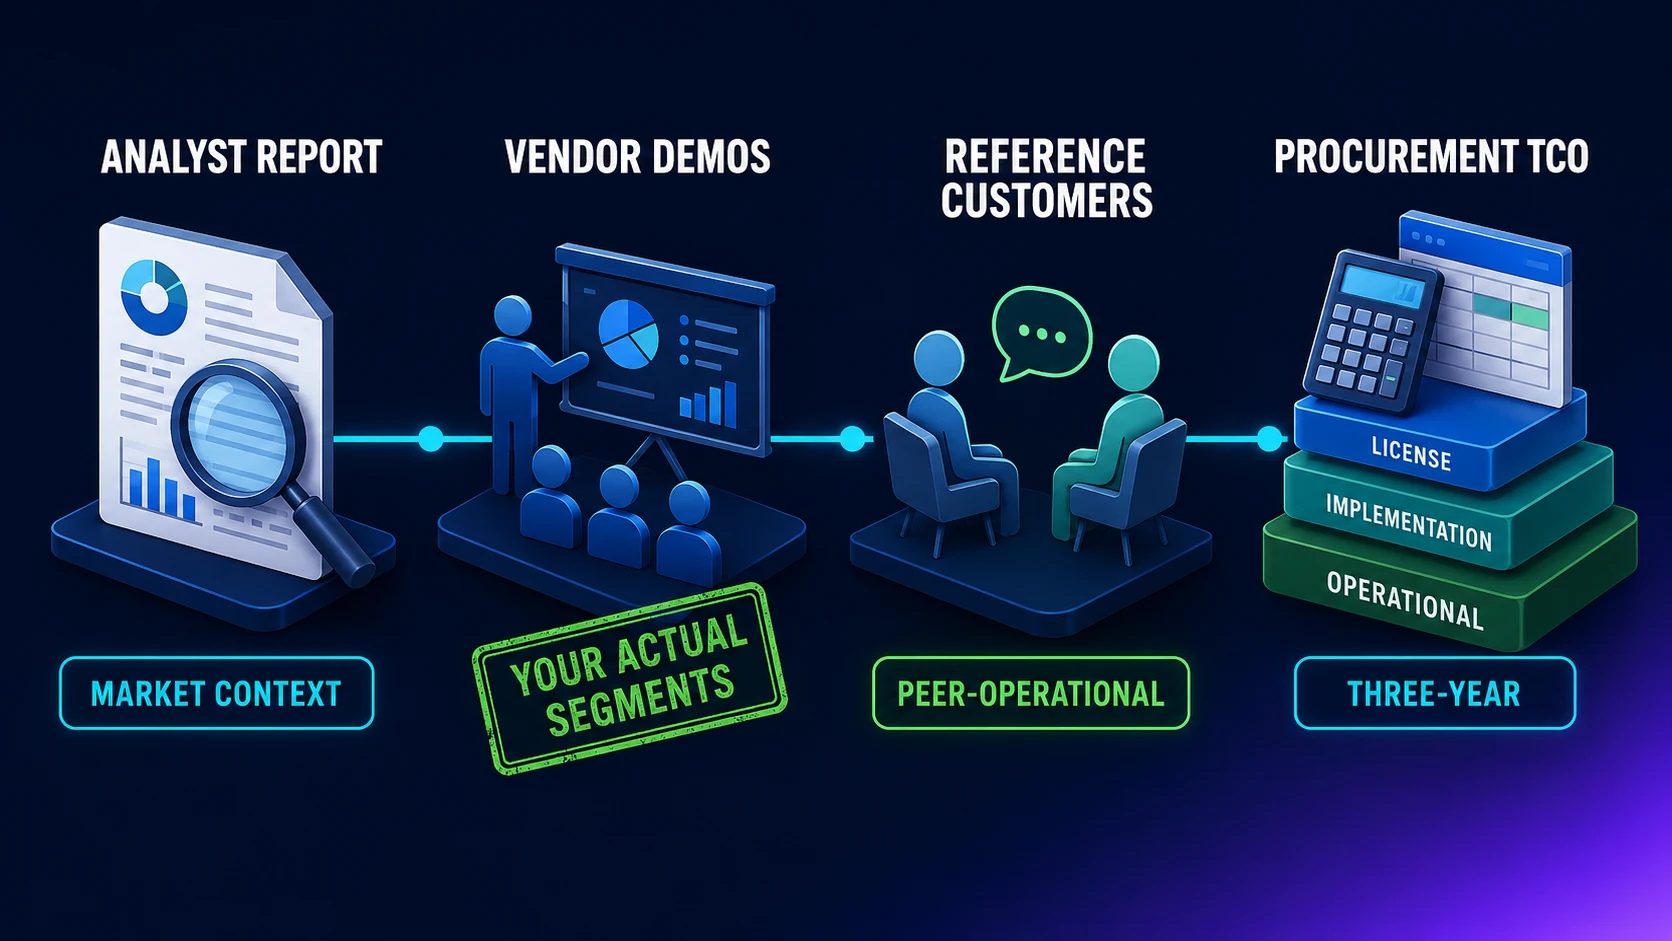
The pattern that produces both an analyst-defensible and operationally sound IGA vendor selection in 2026 has four evidence sources working together. The analyst report is one of the four, not the dominant one.
Source 1: The analyst report itself. For vendor identification, market context, and the validated read on which vendors have product vision and operational execution at the broad market level. Read the methodology section, not just the placements. Pay attention to which evaluation criteria the firm weighted heavily — that tells you what kinds of deployments the placements optimize for.
Source 2: Vendor-led demos against your actual workforce mix. Not against the analyst-firm-generated use cases or the vendor's polished sales demo. Against your actual segments — mainframe operators (if you have them), frontline shared-workstation populations (if you have them), contractor lifecycle workflows (if you have them), executive provisioning patterns, mixed-platform managed devices. The vendor that survives demos against your specific segments is the operationally fit vendor for your deployment.
Source 3: Reference customer conversations with operationally similar enterprises. Not the vendor's pre-screened reference customers — the ones who happen to be operationally similar to your enterprise (same industry vertical, similar workforce mix, similar regulatory environment, similar size). The honest read from a peer enterprise about deployment timeline, hidden costs, operational challenges, and vendor responsiveness is the most useful procurement evidence available. The analyst report does not provide this; it cannot.
Source 4: Procurement-led TCO modeling that accounts for the full cost stack. License cost is one input. Implementation services are usually larger. Integration work, customization, training, ongoing administration headcount, and organizational change management make up the rest. Procurement teams that model the three-year TCO across all four cost categories get a substantially different vendor ranking than procurement teams that select on license cost or on analyst placement alone.
The four-source pattern produces vendor selections that survive both the procurement review and the production deployment. The analyst report does its job of identifying the vendor field and providing market context; the other three sources fill the operational evidence gap.
What Avatier ships toward this pattern
Avatier is positioned in the IGA category as a platform optimized for enterprises with strong mainframe estates (native RACF, ACF2, Top Secret connectors), service-desk-driven workflow verification (Password Station, Identity Anywhere Lifecycle Management with HRIS-driven joiner-mover-leaver), and lifecycle integration that ties identity provisioning to operational reality rather than just the modern-stack ideal. The market positioning is intentionally not the broadest portfolio in the category; it is the operationally focused fit for the segments where the analyst rubrics historically undercount the deployment reality.
For buyers who use the four-source evidence pattern, Avatier shows up well in the segments where the operational evidence matters more than the analyst placement — mid-market and large-enterprise deployments with mainframe coverage requirements, service-desk-driven recovery architecture (post-Storm-2949), and lifecycle-integrated provisioning that doesn't require ripping out the existing IAM stack. The Best IGA Solutions buyer's guide covers the vendor landscape in the operational depth analyst summaries don't provide.
The Avatier Trust Center publishes our compliance posture (SOC 2 Type II zero exceptions, ISO/IEC 27001:2022, PCI DSS v4.0.1, CSA STAR Level 1, NIST 800-53 Rev. 5 aligned, CISA Secure-by-Design Pledge signatory). The integration architecture is designed to compose cleanly with the existing IAM stack — Avatier does not require rip-and-replace, which is the operational pattern that fits the mid-market and large-enterprise buyer profile where the analyst rubrics most often miss.
The honest closing
Analyst quadrant reports are valuable inputs to enterprise IGA procurement. They identify the vendor field, summarize the competitive landscape, and provide procurement-defensible evidence of due diligence. They are not a recommendation engine. The vendor that the analyst placement suggests is the natural shortlist anchor is often a different vendor than the operationally best fit for any specific buyer. The 2026 procurement pattern that works pairs the analyst report with vendor demos against the actual workforce mix, reference customer conversations with operationally similar enterprises, and procurement-led TCO modeling that accounts for the full cost stack. The buyer who runs the four-source evidence pattern ends up with a vendor selection that survives both the procurement review and the production deployment. The buyer who reads the analyst placement as a recommendation gets a procurement-defensible result that frequently doesn't match the operational reality.
ABOUT THE AUTHOR

Ekna Padmaraj is an AI DevOps Automation Engineer at Avatier, focused on provisioning automation, lifecycle workflows, and the DevOps practices that let identity systems scale without breaking.
More from Buyer's Guides

12 Best Identity Lifecycle Management Tools and Solutions for 2026
Twelve identity lifecycle management platforms compared against the operational reality of running joiner/mover/leaver at workforce scale — including mainframe, service-desk verification, and NIST 800-53 alignment.
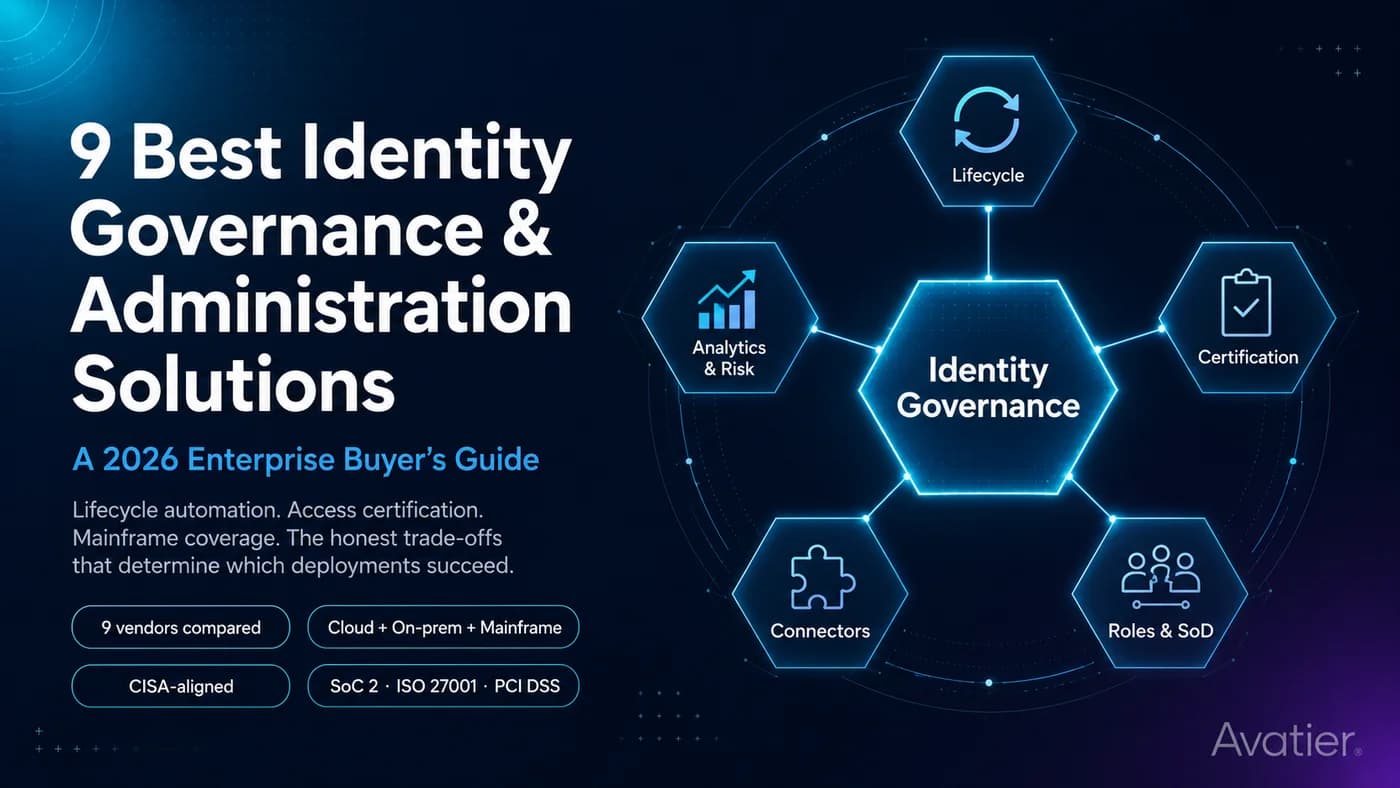
9 Best Identity Governance and Administration (IGA) Solutions for 2026
A 2026 buyer's guide to enterprise identity governance and administration — nine vendors compared on lifecycle automation, access certification, mainframe coverage, and the honest trade-offs that determine which deployments succeed.
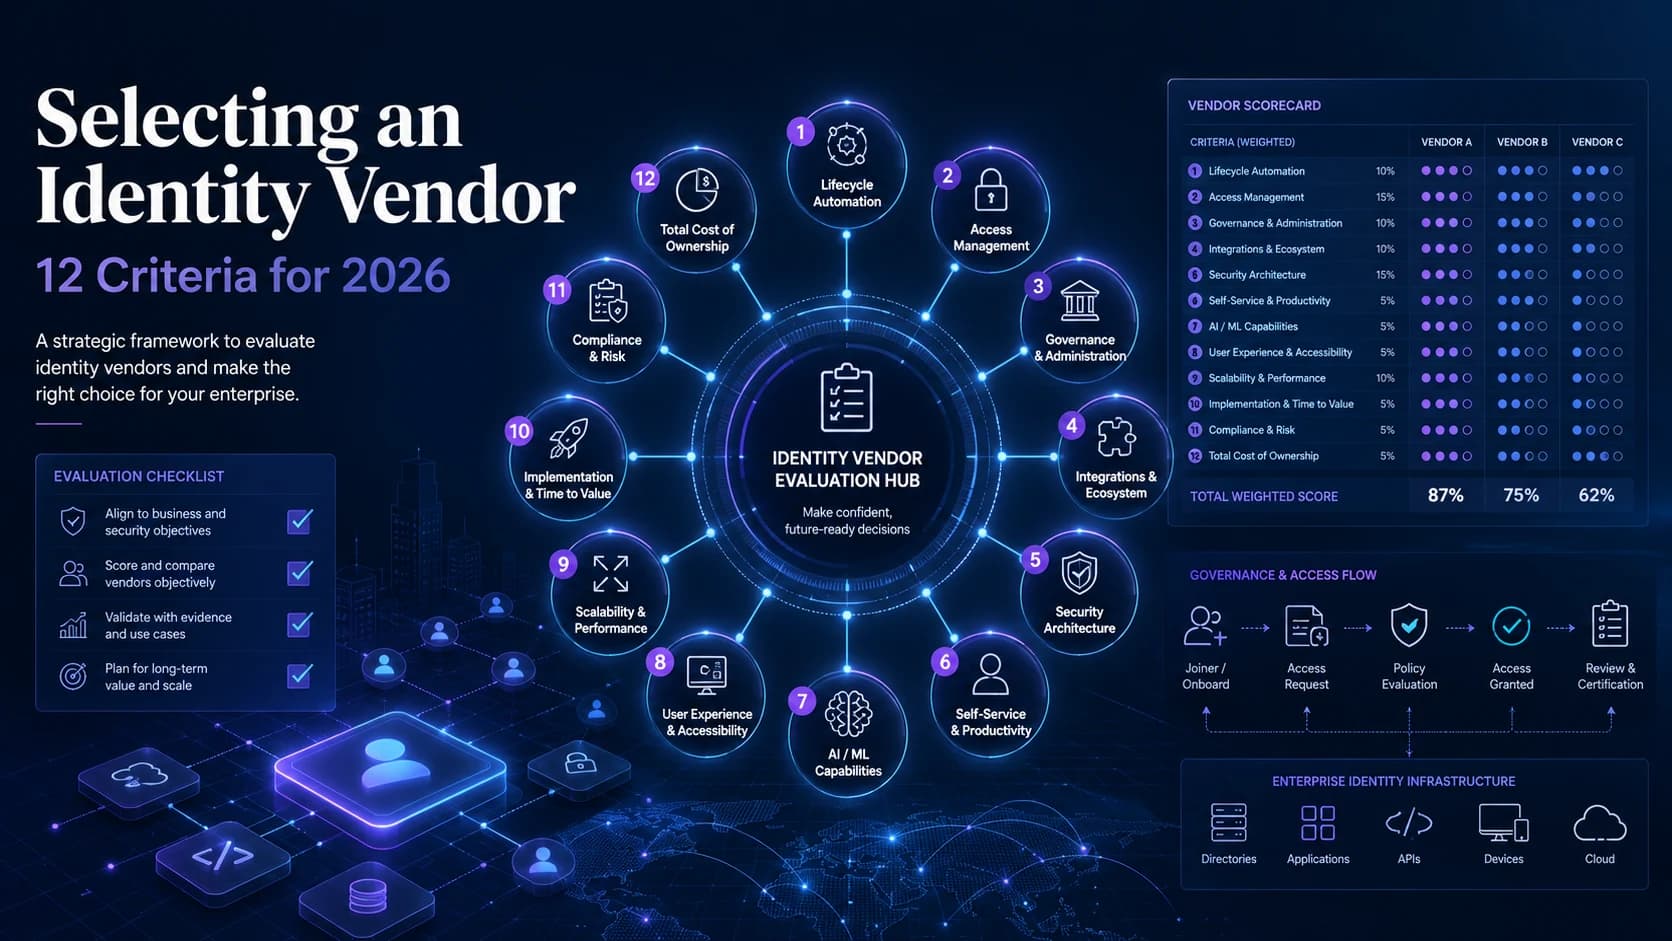
Selecting an Identity Vendor: 12 Criteria for 2026
The evaluation framework for choosing an identity management vendor — what 2026 looks like for each criterion, what to ask in demos, and what trade-offs the vendor probably won't surface.