Digital Identity Costs and ROI: The 2026 Enterprise Business Case
Enterprise IAM investment isn't a cost center — it's a four-category ROI generator that returns breach cost avoidance, help desk savings, compliance value, and workforce productivity gains. The 2026 enterprise reference on what each ROI category actually returns at scale, the maturity-ladder curve that shows where returns compound, the common ROI framing mistakes that make IAM look worse on paper than in reality, and the business case that produces defensible funding for enterprise identity programs.
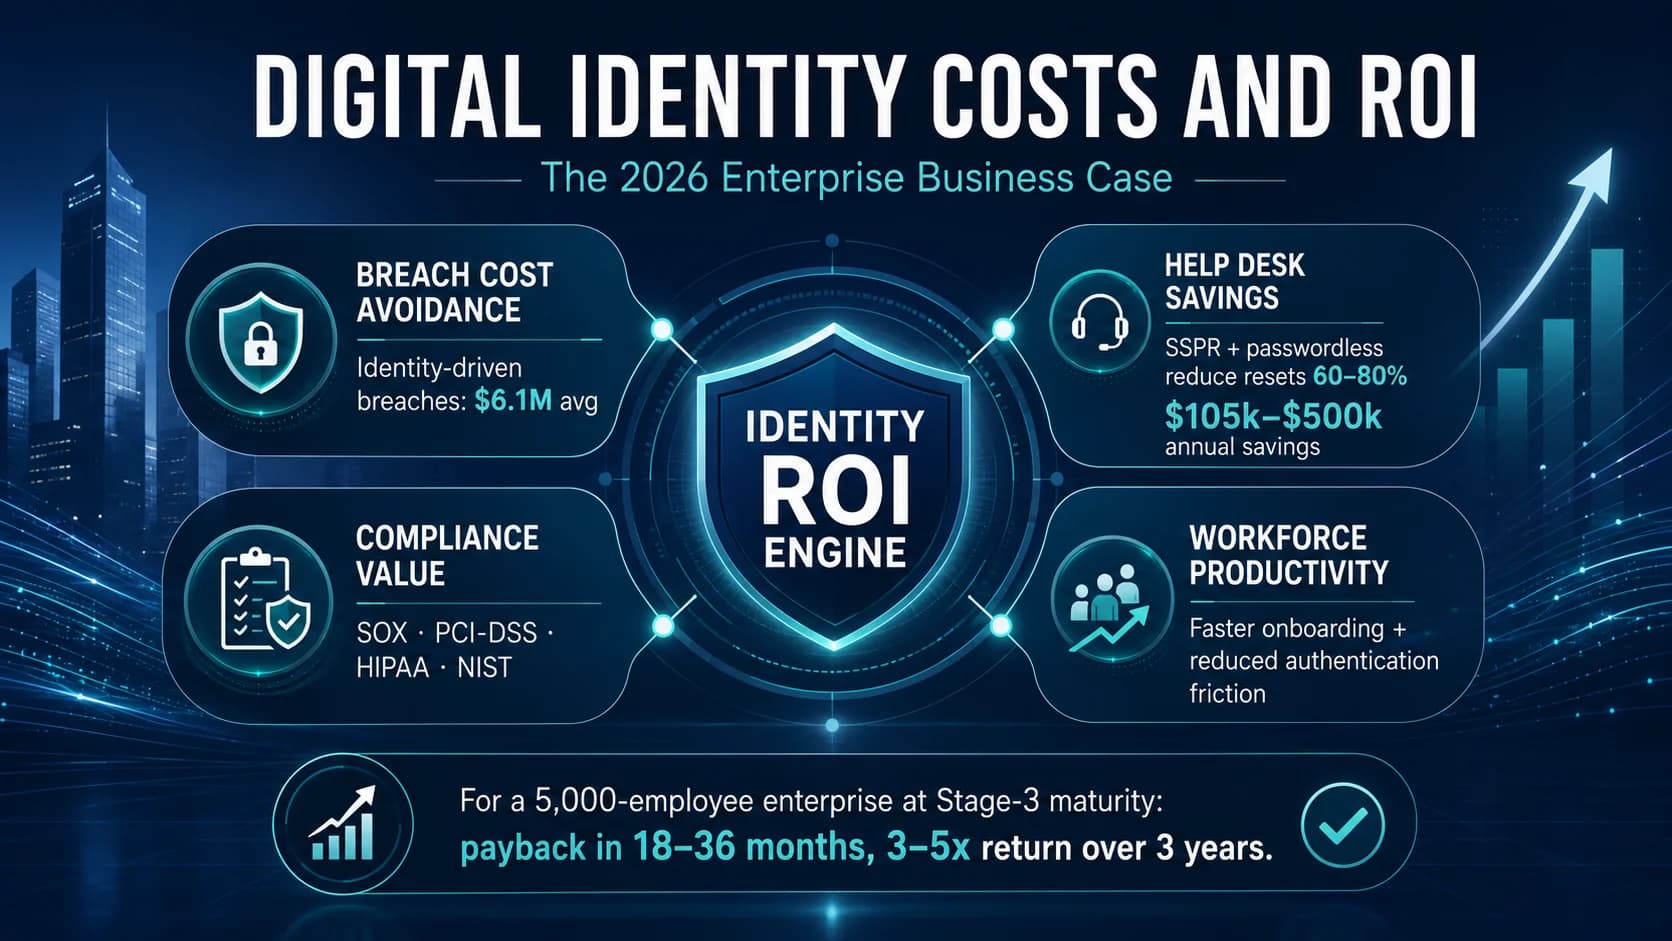
Enterprise IAM investment isn't a cost center — it's a four-category ROI generator that returns breach cost avoidance, help desk savings, compliance value, and workforce productivity gains. The 2026 enterprise reference on what each ROI category actually returns at scale, the maturity-ladder curve that shows where returns compound, the common ROI framing mistakes that make IAM look worse on paper than in reality, and the business case that produces defensible funding for enterprise identity programs.
- Enterprise IAM investment returns across four measurable categories. Breach cost avoidance — identity-driven breaches cost $6.1M average (IBM Cost of a Data Breach report 2025), and identity governance controls that prevent lateral movement, privilege escalation, and credential compromise produce quantifiable reduction in breach probability and impact. Help desk savings — SSPR and passwordless deployment reduce password reset volume 60-80%, worth $105k-$500k annually for typical enterprise deployments. Compliance value — SOX §404 / PCI-DSS v4.0.1 / HIPAA §164.312 / NIST 800-53 alignment reduces audit response cost and enables regulated-market access. Workforce productivity — lifecycle automation eliminates onboarding delays, and reduced authentication friction saves hours per user per year.
- The maturity-ladder curve determines where returns compound. Stage-1 (ad-hoc IAM with ticket-based provisioning) delivers minimal ROI beyond basic compliance. Stage-2 (workflow-driven IAM with HRIS-driven lifecycle and SSPR) captures the help desk savings and workforce productivity gains. Stage-3 (governance-mature IAM with certification, PAM, and SoD) captures the compliance value and initial breach avoidance. Stage-4 (risk-driven IAM with ISPM and ITDR) captures the majority of breach avoidance. Stage-5 (autonomous IAM with continuous authentication and AI-augmented certification) captures the incremental refinement. The [Identity Maturity Model piece](/en/blog/identity-maturity-model-enterprise-2026/) covers the ladder in depth.
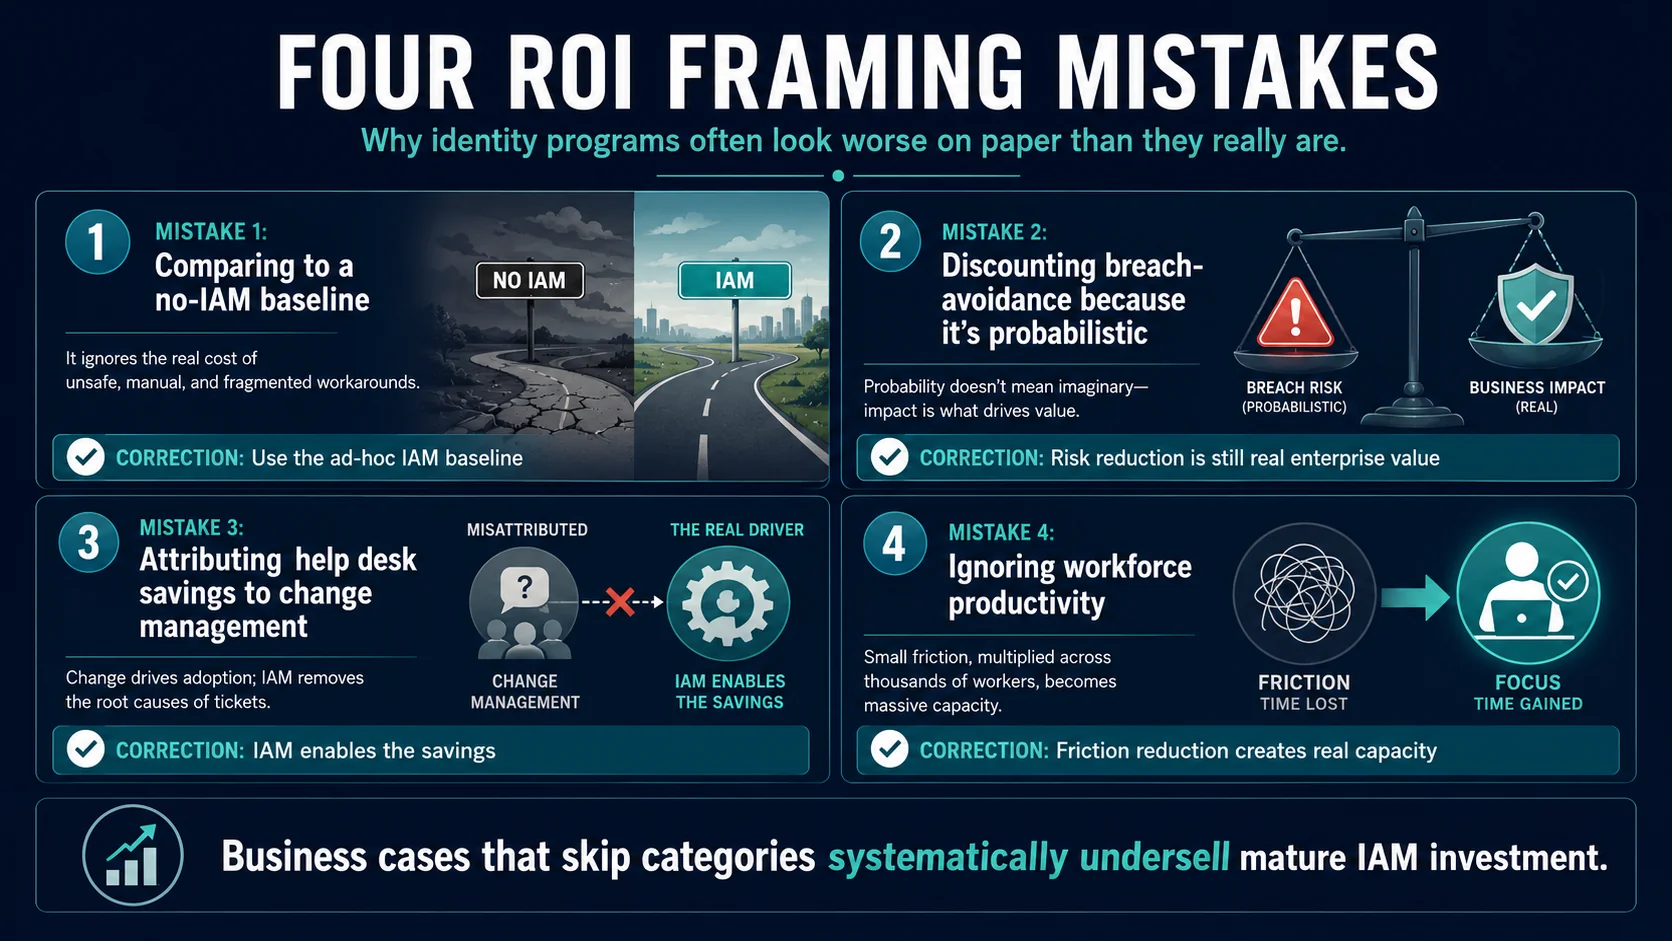
- Common ROI framing mistakes that undersell mature IAM investment. Comparing to no-IAM baseline instead of ad-hoc-IAM baseline (most enterprises already spend on identity through help desk labor, contract labor, and consulting, so 'no IAM' isn't the honest counterfactual). Discounting breach-avoidance ROI because it's probabilistic (regulatory expectations and cyber insurance underwriting increasingly require identity governance investment as a precondition, so avoidance isn't optional). Attributing help desk savings to 'change management' rather than IAM (IAM is what enables the savings; change-management captures a portion but not the majority). Ignoring workforce productivity because it doesn't hit a P&L line (large-scale productivity gains produce revenue expansion at capacity-limited organizations).
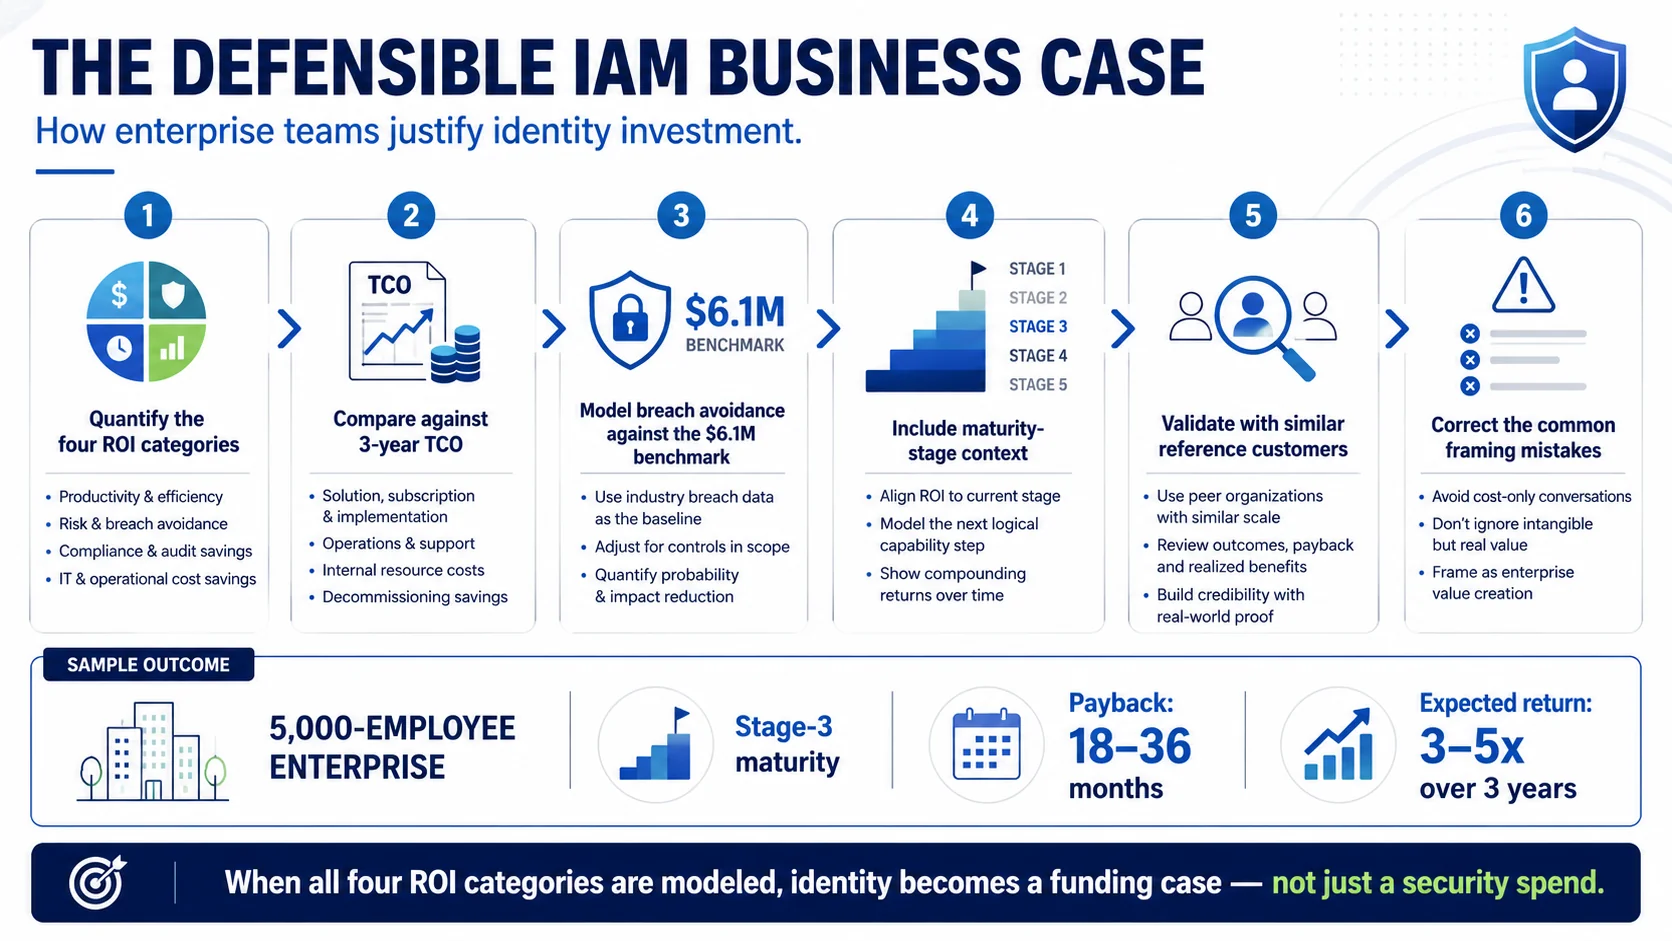
- The defensible business case combines all four ROI categories plus the risk-avoidance quantification against IBM Cost of a Data Breach benchmarks, compared to three-year TCO from the [Enterprise IAM Cost Comparison piece](/en/blog/enterprise-iam-solutions-cost-comparison-2026/). For a 5,000-employee enterprise at Stage-3 maturity, the four-category ROI typically produces payback in 18-36 months and 3-5x returns over the three-year horizon. Larger enterprises with more complex regulatory posture see larger absolute returns and often faster payback.
- For enterprises evaluating enterprise IAM investment, the business case discipline is: quantify each of the four ROI categories against your specific profile (workforce size, application portfolio, regulatory posture, current-state maturity), compare against three-year TCO (five-driver frame from [Enterprise IAM Cost Comparison piece](/en/blog/enterprise-iam-solutions-cost-comparison-2026/)), model the risk-avoidance quantification against IBM breach benchmarks, and validate against reference customers with similar profiles. Business cases that skip categories undersell mature IAM investment; business cases that include all four typically show defensible payback and returns for Stage-3+ deployments.
Enterprise IAM investment is routinely framed as a cost center — "how much does this cost?" — when the honest framing is "what does this return?" IAM produces returns across four measurable categories: breach cost avoidance, help desk savings, compliance value, and workforce productivity gains. For typical enterprise profiles at Stage-3 maturity, the four-category ROI produces payback in 18-36 months and 3-5x returns over the three-year horizon. Business cases that account for all four categories look meaningfully different from business cases that ignore three of them and quibble about the fourth.
This piece is the 2026 enterprise reference on the digital identity investment business case. What each of the four ROI categories actually returns at scale, the maturity-ladder curve that determines where returns compound, the common ROI framing mistakes that undersell mature IAM investment, and the defensible business case that produces funding for enterprise identity programs. Companion pieces cover adjacent layers — the Enterprise IAM Cost Comparison piece covers the three-year TCO frame this ROI compares against; the Hidden Costs of Identity Management piece covers the cost categories that get undercounted; the Identity Maturity Model piece covers the maturity ladder that determines yield rates.
The four ROI categories
Enterprise IAM investment returns across four measurable categories. Each category has its own quantification approach; the composed business case combines all four.
Category 1: Breach cost avoidance. Identity-driven breaches cost $6.1M average per IBM Cost of a Data Breach report 2025 — meaningfully higher than the $4.9M average for all breach types. The delta reflects that identity-driven breaches typically involve lateral movement, privilege escalation, and prolonged undetected access — all of which extend the breach lifecycle and increase impact.
Identity governance controls produce quantifiable reduction in identity-driven breach probability and impact. Certification campaigns catch dormant privileged access before it's exploited. PAM elevation discipline reduces standing admin surface. ISPM continuous posture audit catches over-privileged accounts before compromise. ITDR runtime detection catches privilege abuse before material impact. The ISPM piece and ITDR piece cover the specific runtime layers.
Quantification approach: model organization-specific breach probability with and without the identity controls, apply IBM benchmark cost, produce annual avoidance value. Even conservative probability estimates (5-10% annual reduction) produce material avoidance value at the $6.1M identity-driven benchmark.
Category 2: Help desk savings. SSPR (self-service password reset) and passwordless deployment reduce password reset ticket volume 60-80% versus help-desk-only reset. At $70 per ticket (Password Reset Comprehensive Guide piece covers the cost economics), a 5,000-employee enterprise with 30% annual reset volume saves $60k-$95k annually just from reset-volume reduction. Add SSPR-eligible reset workflow that saves workforce productivity (25 minutes per incident × 900-1,200 avoided incidents = 375-500 workforce hours annually at $50/hour = $18k-$25k). Larger enterprises with higher volume or higher cost see proportional scaling.
Total help desk savings for typical enterprise deployments: $105k-$500k annually depending on scale, current-state volume, and reset-cost baseline.
Category 3: Compliance value. Three sub-categories compose compliance value.
Audit response cost reduction. Enterprises with mature IAM governance produce audit-response cycles that are 30-50% shorter and less labor-intensive than enterprises with immature IAM. The SOX Compliance piece, PCI-DSS v4.0.1 piece, HIPAA §164.312 piece, and Access Review Auditor vs Checkbox piece cover the audit-facing quality that produces this reduction.
Regulated-market access value. Enterprises with mature IAM governance can enter regulated markets (financial services, healthcare, defense) that are gated on identity governance postures. The revenue value of regulated-market access is often the largest component of compliance ROI for organizations expanding into these segments.
Penalty and enforcement exposure reduction. Regulatory penalties for identity-driven compliance failures (HIPAA violations at $50k-$1.5M per violation, PCI-DSS penalties, SOX enforcement actions) produce direct financial exposure. Mature IAM governance reduces the probability of penalty exposure meaningfully.
Category 4: Workforce productivity. Two sub-categories compose workforce productivity value.
Lifecycle automation reducing onboarding delays. Manual joiner provisioning at 3-5 day delays affects hundreds of new hires per year at scale. The productivity impact per new hire is real — an engineer without access can't ship, a sales rep without CRM access can't sell, a clinician without EHR access can't chart. Model $500-$1,000 per new-hire productivity impact times new-hire volume. The HRIS-Driven Lifecycle piece covers the lifecycle automation architecture.
Reduced authentication friction across the workforce. Password reset events, MFA fatigue, and authentication delays sum to hours per user per year. At fully-loaded workforce cost, the annual friction cost is a real line item. Passwordless deployment (Passkey Deployment Playbook piece on ICC) reduces friction meaningfully.
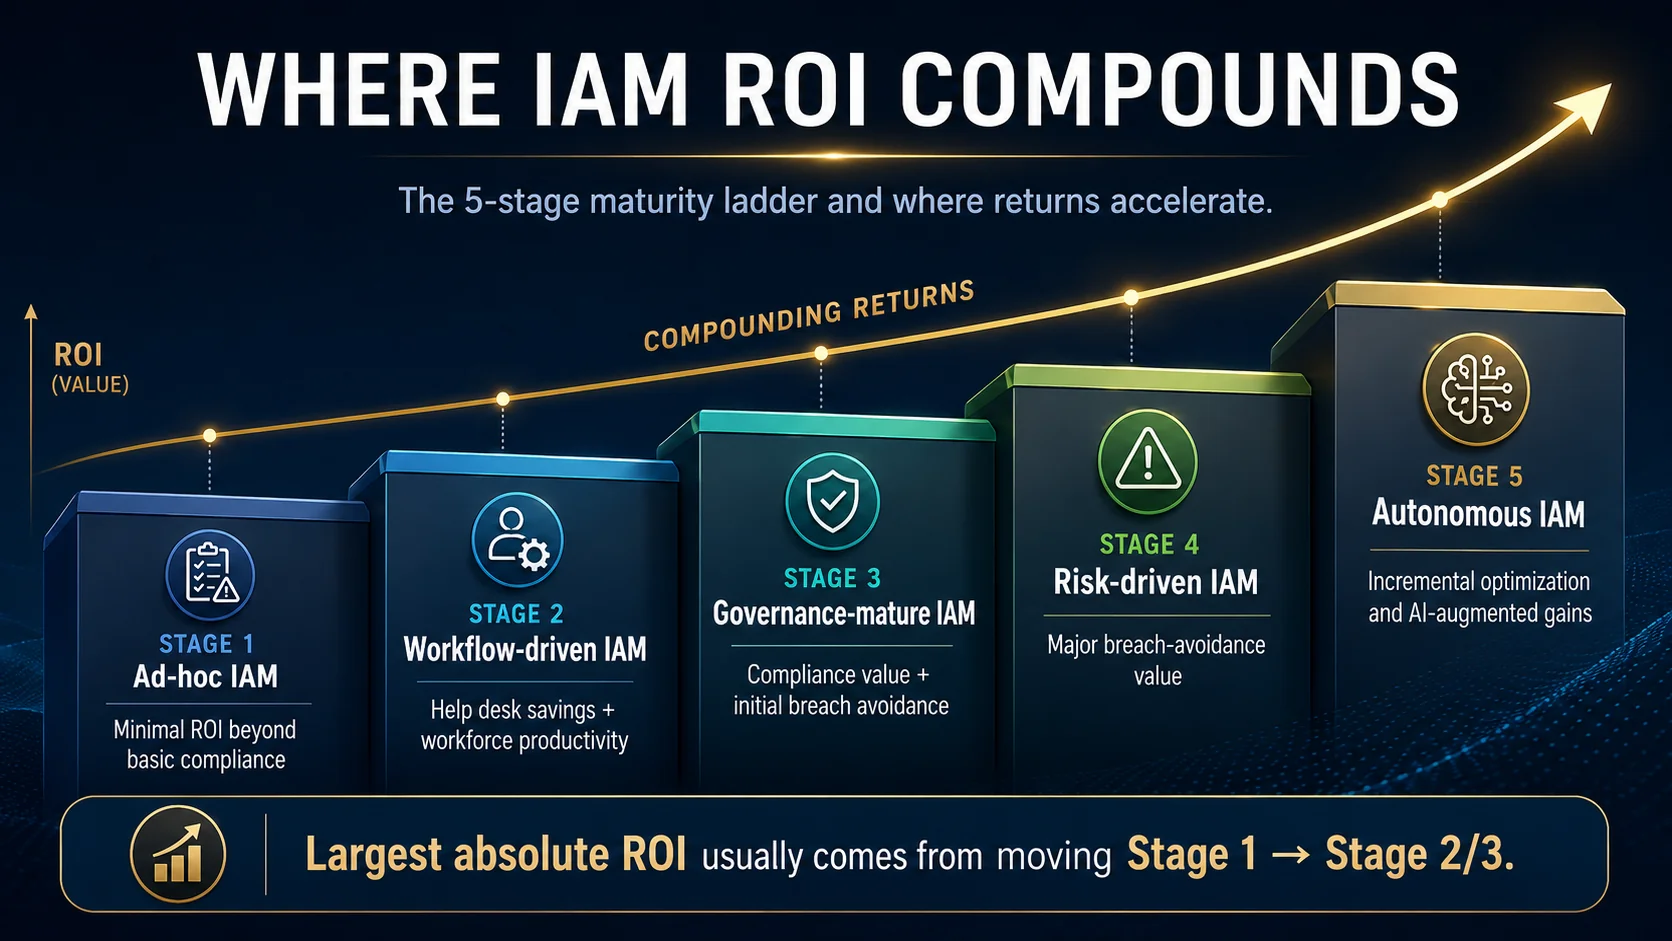 Four measurable ROI categories. Every enterprise IAM investment returns across all four; business cases that model only one or two systematically undersell the actual return profile.
The maturity-ladder curve
Five-stage maturity ladder maps to different ROI-category yield rates. Understanding where your organization sits determines which returns you should model.
Stage-1: Ad-hoc IAM. Ticket-based provisioning, spreadsheet-based access reviews, SMS OTP, per-application credentials, help desk-only password reset. Baseline stage for many enterprises before IAM investment. Minimal ROI beyond basic compliance box-checking; investment moving to Stage-2 captures the largest incremental ROI.
Stage-2: Workflow-driven IAM. HRIS-driven lifecycle, SSPR deployment, workflow-based access request, foundational MFA. Captures the help desk savings and workforce productivity gains. This is where the operational ROI categories first show meaningful returns. Payback typically 12-24 months at Stage-1-to-Stage-2 investment.
Stage-3: Governance-mature IAM. Certification campaigns with real reviewer engagement, PAM discipline, SoD analysis, non-employee lifecycle governance. Captures the compliance value and initial breach avoidance. Audit response cost drops meaningfully; entitlement-quality controls reduce breach probability. Payback typically 18-36 months at Stage-2-to-Stage-3 investment.
Stage-4: Risk-driven IAM. ISPM continuous posture audit (ISPM piece), ITDR runtime detection (ITDR piece), adaptive authentication with risk-based step-up (Adaptive Authentication piece on ICC). Captures the majority of breach avoidance value. Payback typically 24-48 months at Stage-3-to-Stage-4 investment, with breach-avoidance value dominating.
Stage-5: Autonomous IAM. Continuous authentication for high-risk workforces (Continuous Authentication piece on ICC), AI-augmented certification, agentic identity for AI workloads (Identity for AI Agents piece on ICC). Incremental refinement of Stage-4 capabilities. Marginal returns smaller than earlier stages but still positive.
The practical implication. Enterprises at Stage-1 investing to move to Stage-2/3 see the largest absolute ROI in the first program cycle. Enterprises at Stage-3/4 investing to move to Stage-4/5 see incremental but still positive returns. The Identity Maturity Model piece covers the ladder in depth with organizational assessment discipline.
 The maturity-ladder ROI curve. Stage-1 organizations investing to reach Stage-2/3 see the largest absolute returns; Stage-3+ organizations investing incrementally see refinement returns. Modeling ROI without maturity context produces misleading business cases.
The common ROI framing mistakes
Four framing mistakes recur across enterprise IAM business cases and consistently undersell mature IAM investment.
Mistake 1: Comparing to no-IAM baseline instead of ad-hoc-IAM baseline. Most enterprises already spend meaningful money on identity — help desk labor for password resets, contract labor for manual provisioning, consulting for audit-response cycles, workforce-time cost for authentication friction. The honest counterfactual for enterprise IAM investment is "ad-hoc IAM with the current cost base," not "no IAM with zero cost." Business cases that use the no-IAM baseline effectively double-count the IAM investment against a zero-cost starting point that doesn't exist.
Mistake 2: Discounting breach-avoidance ROI because it's probabilistic. Regulatory expectations (SOX, PCI-DSS, HIPAA) and cyber insurance underwriting increasingly require identity governance investment as a precondition for regulated-market access or reasonable insurance premiums. Breach avoidance isn't optional at Stage-3+ enterprises — the regulatory and insurance pressure treats it as required. The ROI is real even if the exact breach probability is uncertain.
Mistake 3: Attributing help desk savings to 'change management' rather than IAM. IAM is what enables the savings. SSPR, passwordless, lifecycle automation are IAM capabilities. Change-management captures a portion of the operational effort (workforce training, communication, adjustment) but the savings themselves come from the IAM investment. Business cases that mis-attribute the savings undersell IAM's contribution.
Mistake 4: Ignoring workforce productivity because it doesn't hit a P&L line directly. Large-scale productivity gains produce capacity expansion at capacity-limited organizations — a sales team that closes deals faster generates revenue expansion; an engineering team that ships faster generates revenue expansion; a clinical team that sees more patients generates revenue expansion. The ROI is real; it just requires modeling revenue impact rather than cost savings.
Business cases that account for all four framing mistakes typically show materially better ROI than baseline business-case templates.
 Four framing mistakes that consistently undersell mature IAM investment. Corrected business cases show payback that survives CFO scrutiny; uncorrected business cases produce false negatives that block funding for value-creating IAM programs.
The defensible business case
Six-step discipline produces a defensible IAM investment business case.
Step 1: Quantify each of the four ROI categories against your specific profile. Model breach cost avoidance against IBM benchmarks and your specific breach probability. Model help desk savings against your current-state reset volume and cost baseline. Model compliance value against your specific regulatory surface. Model workforce productivity against your workforce composition and onboarding volume.
Step 2: Compare against three-year TCO using the five-driver frame. Apply the Enterprise IAM Cost Comparison piece five-driver model — infrastructure, implementation, ongoing operations, integrations, and hidden compliance surface. Total three-year TCO is the honest denominator.
Step 3: Model the risk-avoidance quantification against IBM Cost of a Data Breach benchmarks. Use the 2025 report's $6.1M identity-driven breach cost baseline. Apply organization-specific probability with and without the identity controls. Even conservative probability reduction estimates produce material avoidance value.
Step 4: Include the maturity-ladder context. Model your current-state maturity and the target-state maturity. Different transitions produce different ROI profiles. Business cases that ignore the maturity-ladder context often over-project or under-project depending on the specific stage transition.
Step 5: Validate against reference customers with similar profiles. Both vendors have reference customer programs. Prioritize references with your specific environment complexity — workforce size, regulatory posture, current-state maturity, legacy footprint. Generic references don't validate your specific business case.
Step 6: Include the four ROI framing mistakes correction. Use the ad-hoc-IAM baseline, not no-IAM baseline. Include breach avoidance despite probability uncertainty. Attribute help desk savings to IAM. Include workforce productivity.
The six-step discipline produces a business case that's defensible to CFO scrutiny, board review, and cross-functional executive alignment.
The 2026 reference path
Model all four ROI categories: breach cost avoidance against IBM benchmarks, help desk savings against your reset economics, compliance value against your regulatory surface, workforce productivity against your workforce composition.
Understand your current-state maturity on the Identity Maturity Model piece ladder. Different stages produce different ROI-category yield rates.
Compare against three-year TCO using the five-driver frame from the Enterprise IAM Cost Comparison piece. Include hidden costs from the Hidden Costs of Identity Management piece.
Correct the four ROI framing mistakes. Use ad-hoc-IAM baseline. Include breach avoidance. Attribute help desk savings correctly. Include workforce productivity.
Validate against reference customers with similar environment complexity.
Point auditors and buyers at the Trust Center for Avatier's own posture. The Avatier Trust Center with the SecurityScorecard grade view — SOC 2 Type II with zero exceptions, ISO/IEC 27001:2022, PCI DSS v4.0.1, CSA STAR Level 1, NIST 800-53 Rev. 5 aligned, CISA Secure-by-Design Pledge signatory.
ABOUT THE AUTHOR

More from Buyer's Guides

IAM Vendors in 2026: How the Market Breaks Down
A category-level guide to how the IAM vendor market segments into suites, point solutions, and platform plays, plus the criteria and red flags that separate real capability from marketing claims.
SailPoint vs Avatier: The 2026 Enterprise Pricing Model Comparison
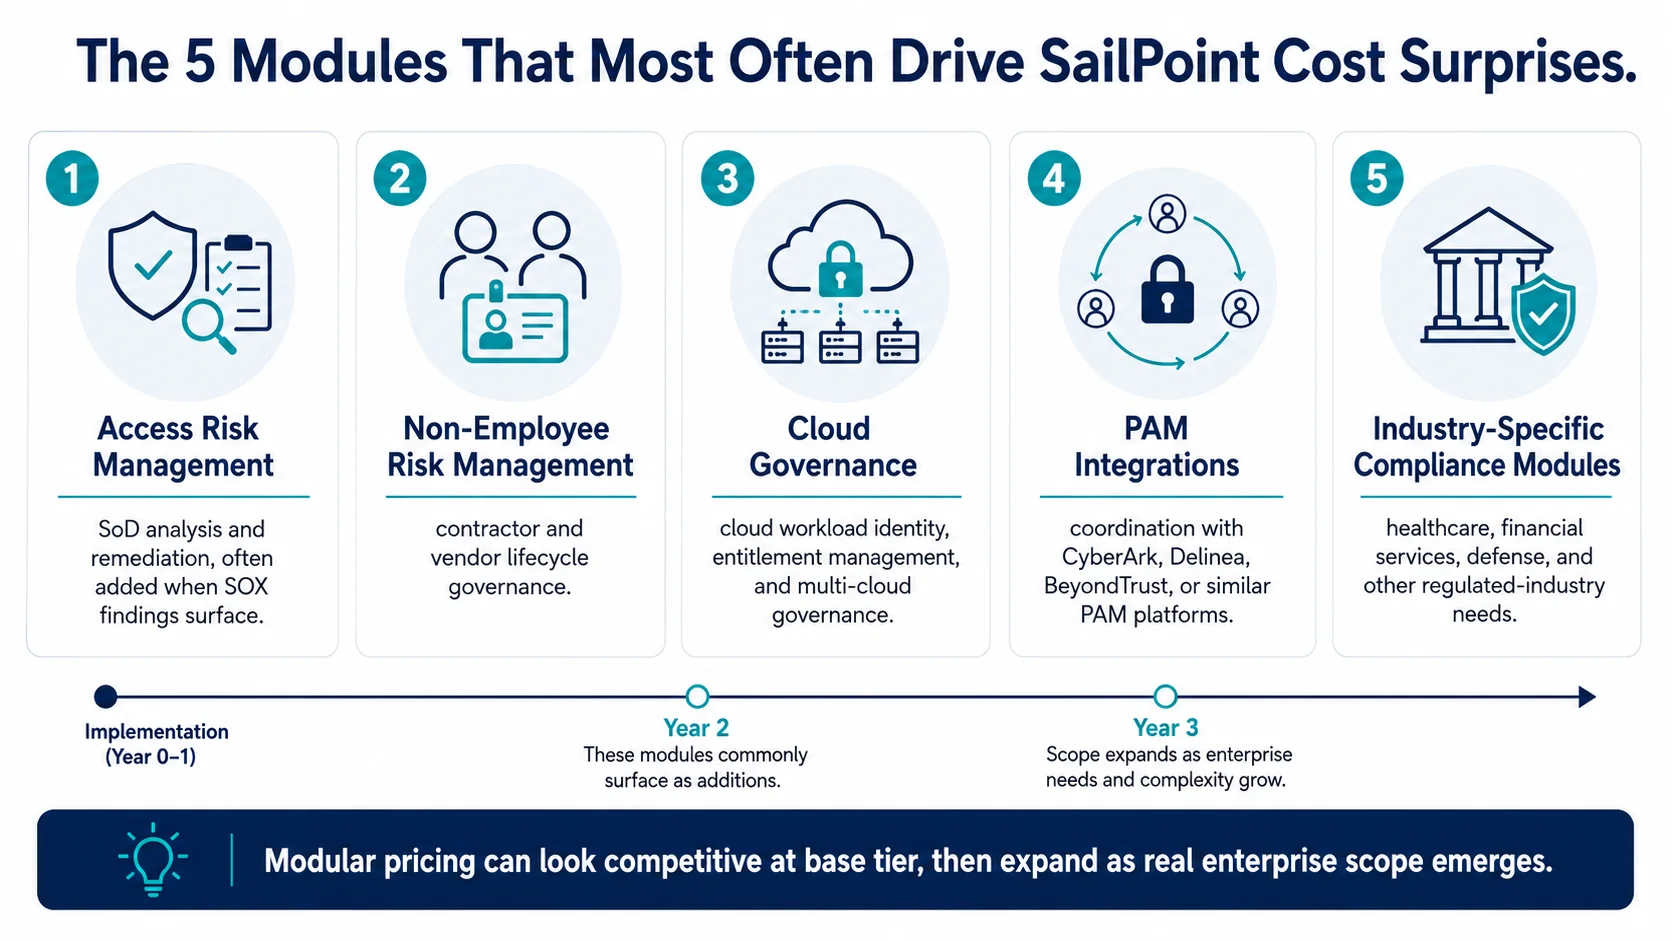
Enterprise IAM buyers evaluating SailPoint against Avatier are comparing two fundamentally different pricing philosophies — modular per-capability pricing with premium tiers and per-connector charges versus all-inclusive licensing that bundles the same capability set into the base license. The 2026 enterprise reference on the structural pricing differences, the modules that drive most of the SailPoint cost surprises, the Avatier all-inclusive positioning, and the buyer-side comparison discipline that produces defensible vendor selection instead of feature-checklist theater.

Login Reset Licensing Models: The 2026 Enterprise Cost Structure Reference
Enterprise password reset licensing has three fundamentally different pricing models — per-user subscription, per-reset-event consumption, and modular capability-based licensing — and the fit between model and buyer profile determines whether TCO tracks the vendor's list-price projection or surprises 18-24 months into deployment. The 2026 enterprise reference on the three licensing models, the specific line items that drive cost variance, and the buyer discipline that produces defensible reset-workflow vendor selection.