Enterprise IAM Solutions Cost Comparison: The 2026 TCO Reference
Enterprise IAM total cost of ownership isn't a per-user list price — it's a five-driver model where infrastructure, implementation, ongoing operations, integrations, and the hidden compliance surface compose into the actual multi-year spend. The 2026 enterprise reference on what drives IAM cost, how to compare vendor pricing models honestly, the hidden costs auditors surface, and the three-year TCO calculation frame that separates real cost comparison from list-price theater.
Enterprise IAM total cost of ownership isn't a per-user list price — it's a five-driver model where infrastructure, implementation, ongoing operations, integrations, and the hidden compliance surface compose into the actual multi-year spend. The 2026 enterprise reference on what drives IAM cost, how to compare vendor pricing models honestly, the hidden costs auditors surface, and the three-year TCO calculation frame that separates real cost comparison from list-price theater.
- Enterprise IAM total cost of ownership is a five-driver model — infrastructure, implementation, ongoing operations, integrations, and the hidden compliance surface. List price per user is one input among five; treating it as the whole comparison produces cost surprises 18-24 months into deployment when the other four drivers surface at their full scale.
- The three dominant vendor pricing models in 2026 — per-user subscription, consumption-based, and perpetual license with maintenance — each optimize different buyer profiles. Per-user pricing suits stable workforce sizes; consumption pricing suits variable workloads and non-human identity sprawl; perpetual licensing suits organizations that can absorb the upfront capital and benefit from long-term amortization.
- The hidden costs that auditors surface — and that IAM buyers systematically undercount — include SSO integration cost per application (typically $500-2,000 per SaaS integration), custom connector development for non-standard target systems, MFA credential distribution and replacement, help desk volume during initial rollout (often 3-5x normal for the first quarter), and the compliance-mapping work that keeps the audit-ready posture the platform enables.
- The vendor landscape has consolidated into four archetypes — enterprise IGA platforms (SailPoint, Saviynt, Ping Identity, Oracle IGA), workforce IdP platforms with expanding IGA capability (Okta, Microsoft Entra), specialized platforms for regulated industries and complex environments (Avatier, One Identity, Bravura), and cloud-native workload identity (AWS IAM Identity Center, Azure AD, Google Cloud Identity). Cost profiles differ substantially by archetype; direct list-price comparison across archetypes is often meaningless.
- The defensible cost comparison uses a three-year TCO calculation that includes all five drivers, priced against the specific use-case profile (workforce size, application count, non-human identity scale, regulatory posture, migration state). Ballpark ranges — mid-market $150k-$500k Y1, $80k-$300k Y2-3; enterprise $500k-$2M Y1, $300k-$1M Y2-3; large enterprise $2M-$8M Y1, $1M-$4M Y2-3. Vendor-specific costs land within these bands per environment complexity.
Enterprise IAM total cost of ownership is one of the most consistently misunderstood line items in the security-technology budget. The list-price-per-user comparison that dominates initial vendor discussions captures roughly one input into one of five actual cost drivers. Buyers who anchor on list price systematically get surprised 18-24 months into deployment when the other four drivers surface at their operational scale — and the surprise looks like "the vendor cost more than we budgeted" when the operational reality is "we compared list price when we should have compared TCO."
This piece is the 2026 enterprise reference on IAM cost comparison. The five drivers that compose TCO, the three vendor pricing models and what buyer profile each optimizes for, the hidden costs that auditors surface and buyers systematically undercount, the four vendor archetypes that dominate the 2026 landscape, and the three-year TCO calculation frame that separates defensible cost comparison from list-price theater. Companion pieces cover adjacent layers — the Best IGA Solutions piece and Best ILM Solutions piece cover vendor-specific comparisons; the Playbook Legacy IAM to Modern piece covers the migration architecture that cost decisions get made against; the Identity Maturity Model piece covers the maturity ladder that shapes what cost-effective looks like at each stage.
The five drivers of IAM TCO
Enterprise IAM TCO is a five-driver model. Every real deployment cost lives inside one of these five buckets. The share-of-total varies by deployment model, vendor archetype, and organizational maturity, but the buckets themselves are universal.
Driver 1: Infrastructure. For SaaS-delivered IAM, this is the vendor's cloud consumption cost passed through — typically bundled into subscription pricing but sometimes surfaced as separate line items for high-volume tenants. For self-hosted deployments, this is your servers, database licensing, storage, networking, and disaster-recovery infrastructure. Typical Y1 share: 5-15% for SaaS-delivered deployments, 20-35% for self-hosted. The share shifts downward for self-hosted over the amortization horizon as capital costs spread across years.
Driver 2: Implementation. The initial deployment project — discovery of the current state, configuration of the target state, integration development for the application portfolio, testing across environments, workforce training, phased cutover, and post-cutover hypercare. Typical Y1 share: 25-45%. This driver is near-zero in subsequent years unless the deployment expands significantly (new business unit, acquisition integration, regulatory-driven expansion). Under-scoping implementation is one of the most common cost-comparison mistakes because implementation cost is highly variable by environment complexity but often assumed to be a fixed fraction of subscription.
Driver 3: Ongoing operations. The platform-team headcount that runs the deployment. IAM engineers, security operations analysts, SREs assigned to identity infrastructure, help desk staff dedicated to identity-related tickets, incident response for identity-driven incidents, capacity planning and upgrades, vendor management. Typical ongoing yearly share: 20-35%. This driver scales with workforce size, application portfolio complexity, and non-human identity count — a five-person platform team is common for mid-market, an eight-to-fifteen person team for enterprise, larger for organizations at ISPM maturity (ISPM piece).
Driver 4: Integrations. SSO connectors for the application portfolio (SaaS and on-premises), lifecycle connectors for HRIS-driven provisioning (HRIS-Driven Lifecycle piece), PAM integrations, MDM integrations, and custom-application development for target systems where connectors don't exist out-of-box. Typical Y1 share: 15-30%. Ongoing share: 10-20% as the application portfolio evolves and new applications require connector work. Underestimating integration cost is the most common Y2 cost surprise — the "we thought SSO was free" pattern.
Driver 5: The hidden compliance surface. The audit-response work, the certification-campaign labor, the reporting infrastructure, the compliance-mapping effort that keeps the audit-ready posture the platform enables. Typical ongoing yearly share: 10-25%. This driver scales sharply with regulatory posture — SOX, PCI-DSS v4.0.1, HIPAA §164.312, and multi-framework organizations pay meaningfully more here than lightly-regulated environments. Covered in the SOX Compliance piece, PCI-DSS v4.0.1 piece, and HIPAA §164.312 piece.
The composition of these five drivers is what actual TCO looks like. List-price-per-user times headcount is one input to driver 1 and driver 2; treating it as the whole comparison misses 70-85% of the actual cost.
 Five drivers. Every real deployment cost lives inside one of these buckets. Share-of-total shifts by deployment model and organizational maturity, but the buckets themselves are universal.
The three pricing models and what buyer profile each optimizes
The dominant vendor pricing models in 2026 optimize different buyer profiles. Understanding which model fits your specific operational reality matters more than negotiating discount percentages on whichever model the vendor initially proposes.
Per-user subscription is the dominant SaaS-delivered IAM pricing model. Per-employee per-month or per-year, sometimes with tiered pricing based on module selection (base federation and MFA vs full IGA vs governance-plus-PAM). Pricing transparency is high — the list price is knowable from vendor documentation. TCO predictability is good for stable workforces. Best fit: organizations with predictable workforce sizes, low seasonal fluctuation, and steady growth trajectories. The trap: per-user pricing understates cost for organizations with heavy non-human identity sprawl (Service Account Governance / NHI piece) — service accounts, AI agents, workload identities, and IoT devices all authenticate through the platform but often aren't priced or aren't fully priced.
Consumption-based pricing charges by identity operations — authentication events, provisioning events, API calls — or by resource consumption. Suits organizations with variable workloads, seasonal workforce fluctuations (retail with holiday hiring, healthcare with rotational staffing), heavy non-human identity load, or workloads that vary substantially by time-of-day or workload class. Pricing transparency is moderate — you can price a specific operational profile but comparing across profiles requires modeling. TCO predictability requires forecast discipline. Best fit: organizations where per-user pricing wouldn't cleanly represent actual identity operations volume, especially those with substantial machine identity or workload identity load.
Perpetual license with annual maintenance is the traditional enterprise-software model. Upfront capital purchase covering the license, with annual maintenance (typically 15-20% of license price) covering upgrades and support. Best fit: organizations that can absorb Y1 capital, benefit from long-term amortization across 5-7 year horizons, prefer capex-heavy balance-sheet treatment, or have specific regulatory requirements favoring perpetually-owned software over subscription. Pricing transparency is high after negotiation. TCO predictability is very high across the amortization horizon. The trade-off: less flexibility to switch platforms if the deployment underperforms, and the upfront capital commitment gates the initial deployment more than subscription pricing does.
The mature buyer maps its specific operational profile against these three models rather than defaulting to whichever the analyst-press coverage currently favors. The right model for a stable large enterprise with heavy compliance surface is different from the right model for a fast-growing mid-market with variable non-human identity load; treating them the same understates one and overstates the other.
 Three pricing models, three buyer profiles. The right model for a stable enterprise with heavy compliance surface is different from the right model for a fast-growing mid-market with variable machine identity load.
The hidden costs that auditors surface
Five categories of hidden cost recur across audit engagements and buyer post-mortems. Every category is a real line item in the actual TCO; every category is undercounted or missing in a substantial share of initial buyer comparisons.
SSO integration cost per application. Most buyers assume federation is free or near-free at the platform layer, then discover their SaaS vendors charge SSO tax on non-enterprise tiers — typically $500-$2,000 per application per year. Multiply that by 40-80 SaaS applications in a typical enterprise portfolio and the annual SSO tax is a real six-figure line item. On-premises applications require custom connector work at $10k-$50k per non-standard integration when the vendor's out-of-box connector library doesn't cover them. Well-scoped IAM deployments budget for both.
MFA credential distribution and replacement. Hardware FIDO2 keys, smart cards, or Identity Challenge Cards for deviceless workforce segments carry per-unit cost plus logistics — packaging, shipping, replacement rates, refresh cycles. A 5,000-employee enterprise with hardware credentials for privileged users and deviceless credentials for frontline shared-station segments (healthcare bedside, manufacturing floor, contact center) has a real six-figure hardware line item that shows up in Y2 when the initial hardware batches need refresh. The Phishing-Resistant MFA piece on ICC covers the credential-class mix.
Help desk volume during initial rollout. The first quarter of any IAM cutover produces 3-5x normal help desk ticket volume as the workforce adjusts. Users forget new authentication flows, hit false-rejection cases on new biometric enrollment, run into edge cases the pilot didn't surface, and generate volume that overwhelms the normal support team. The temporary staffing, contract-support, or overtime cost is a real Y1 line item that gets attributed to "change management" rather than IAM but is IAM-driven.
Certification-campaign labor. Running certification campaigns produces reviewer-time cost that scales with entitlement count and workforce size. A mature deployment with quarterly campaigns across 5,000 users is 400-800 reviewer-hours per campaign, equivalent to 0.5-1.0 FTE annualized. AI augmentation reduces this substantially (AI Access Certification piece) but doesn't eliminate it — the residual reviewer-engagement work is still a real ongoing cost. The Access Review piece covers the auditor-facing quality of what these campaigns produce.
Compliance-mapping work. The ongoing effort to map IAM controls to SOX §404, PCI-DSS v4.0.1 Requirements 7/8/10, HIPAA §164.312, ISO 27001, NIST 800-53, and industry-specific frameworks. Typically 0.25-0.5 FTE for a compliance-heavy enterprise, near-zero for lightly-regulated organizations. The variance is large; failing to scope this correctly to your specific regulatory profile produces meaningful cost surprises.
All five surface in years 2-3 at scale. Well-scoped Y1 planning includes them; comparisons that omit them undersell the platforms that do a good job of minimizing them and oversell the platforms that push these costs down to the buyer's operational team.
The four vendor archetypes in 2026
The enterprise IAM vendor landscape has consolidated into four archetypes with distinct cost profiles. Direct list-price comparison across archetypes is often meaningless because they optimize for different buyer profiles.
Archetype 1: Enterprise IGA platforms — SailPoint, Saviynt, Ping Identity, Oracle IGA. Traditional heavy-weight IGA vendors with strong governance, certification, and reporting depth. Enterprise-grade cost profile: $100-$300+ per user per year subscription or equivalent perpetual, plus significant implementation cost ($500k-$3M+ for large deployments). Best fit: large enterprises with mature governance requirements, complex regulatory posture, and workforce sizes that amortize the platform overhead. Cost anti-fit: mid-market organizations where the platform capability substantially exceeds actual governance needs.
Archetype 2: Workforce IdP platforms with expanding IGA — Okta, Microsoft Entra. Grew from federation and MFA origins into IGA capability. Cost profile is friendlier at the base tier ($20-$80 per user per year for federation and MFA) but climbs steeply as governance modules are added — a full IGA-equivalent deployment lands in the same band as archetype 1. The composed IGA capability is generally less mature than traditional IGA vendors, which shows up as workflow gaps for complex certification and remediation patterns. Best fit: organizations already committed to the ecosystem for identity infrastructure and needing IGA capability that composes cleanly with existing federation.
Archetype 3: Specialized platforms for regulated industries and complex environments — Avatier, One Identity, Bravura. Combine mature governance with strong support for legacy environments (RACF, iSeries, mainframe adjacency — see the RACF User Access Control piece and Troubleshooting AS400/iSeries piece), specialized workforce segments (deviceless FIDO2 via Identity Challenge Card), and regulated-industry postures. Cost profile is competitive with enterprise IGA at scale with often-lower implementation cost due to platform maturity in the specific target environments enterprise buyers actually need to cover. Best fit: enterprises with substantial legacy footprint, regulated industry postures, or workforce segments that don't fit the smartphone-and-workstation baseline the other archetypes optimize for.
Archetype 4: Cloud-native workload identity — AWS IAM Identity Center, Azure AD, Google Cloud Identity, plus specialized workload identity platforms. This is where cloud-native IAM increasingly lives. Cost profile is favorable for cloud-native organizations because the capability is often bundled into broader cloud spend. Doesn't address the on-premises and legacy environments that enterprise IAM buyers actually need to cover, so this archetype is typically complementary to one of archetypes 1-3 rather than a standalone. Best fit: cloud-native organizations pairing this archetype with archetype 2 or 3 for the on-premises and legacy scope.
The Best IGA Solutions piece covers archetype-1 vendor comparisons in depth; the Best ILM Solutions piece covers lifecycle-specific vendor comparison.
 Four archetypes, four buyer profiles. Comparing archetype-1 list prices to archetype-2 base tier misses that they're solving different problems at different maturity levels.
The three-year TCO calculation frame
Defensible IAM cost comparison uses a three-year TCO calculation that includes all five drivers priced against your specific operational profile. The mechanical frame:
Year 1 costs — vendor subscription or license (all modules that will actually be deployed), implementation project (well-scoped against your specific integration surface), Y1 infrastructure, initial credential-hardware purchase for MFA rollout, first-quarter help desk overhead, and initial compliance-mapping cost.
Year 2-3 recurring costs — vendor subscription or maintenance, ongoing operations headcount (fully loaded), integration-development work for new applications joining the portfolio, hardware credential refresh, certification-campaign labor, and ongoing compliance-mapping.
Year 2-3 expansion costs — new business units, acquisitions, regulatory-scope expansion, or platform-capability expansion that adds to the Y2-3 baseline.
Ballpark ranges for reference:
| Deployment scale | Year 1 TCO | Year 2-3 annual |
|---|---|---|
| Mid-market (500-2,500 users) | $150k-$500k | $80k-$300k |
| Enterprise (2,500-15,000 users) | $500k-$2M | $300k-$1M |
| Large enterprise (15,000+ users) | $2M-$8M | $1M-$4M |
Vendor-specific costs land within these bands per environment complexity, regulatory posture, and vendor-archetype fit. Comparisons that produce numbers substantially outside these ranges are worth double-checking against the drivers to find what got missed or double-counted.
The 2026 reference path
Build the TCO model against your specific operational profile before running RFPs. The five-driver model applied to your workforce size, application portfolio, non-human identity scale, regulatory posture, and legacy environment mix produces a defensible baseline that separates real cost comparison from list-price theater.
Map vendor archetypes to buyer profile. Enterprise IGA (archetype 1) for large enterprises with mature governance requirements. Workforce IdP with expanding IGA (archetype 2) for ecosystem-committed organizations. Specialized platforms (archetype 3) for regulated industries, complex environments, and workforce segments outside the smartphone-and-workstation baseline. Cloud-native workload identity (archetype 4) as complement, not standalone.
Include the hidden costs auditors surface. SSO integration tax per application, MFA credential distribution and refresh, help desk rollout volume, certification-campaign labor, and compliance-mapping work. Well-scoped Y1 planning includes all five; comparisons that omit them mislead the vendor selection.
Use the three-year TCO frame. Y1 total including implementation, plus Y2-3 recurring baseline, plus Y2-3 expansion where knowable. List-price-per-user comparison is one input; TCO is the honest comparison.
Point auditors at the Trust Center for Avatier's own posture. The Avatier Trust Center with the SecurityScorecard grade view — SOC 2 Type II with zero exceptions, ISO/IEC 27001:2022, PCI DSS v4.0.1, CSA STAR Level 1, NIST 800-53 Rev. 5 aligned, CISA Secure-by-Design Pledge signatory.
ABOUT THE AUTHOR

More from Buyer's Guides
IAM Vendors in 2026: How the Market Breaks Down
A category-level guide to how the IAM vendor market segments into suites, point solutions, and platform plays, plus the criteria and red flags that separate real capability from marketing claims.
SailPoint vs Avatier: The 2026 Enterprise Pricing Model Comparison
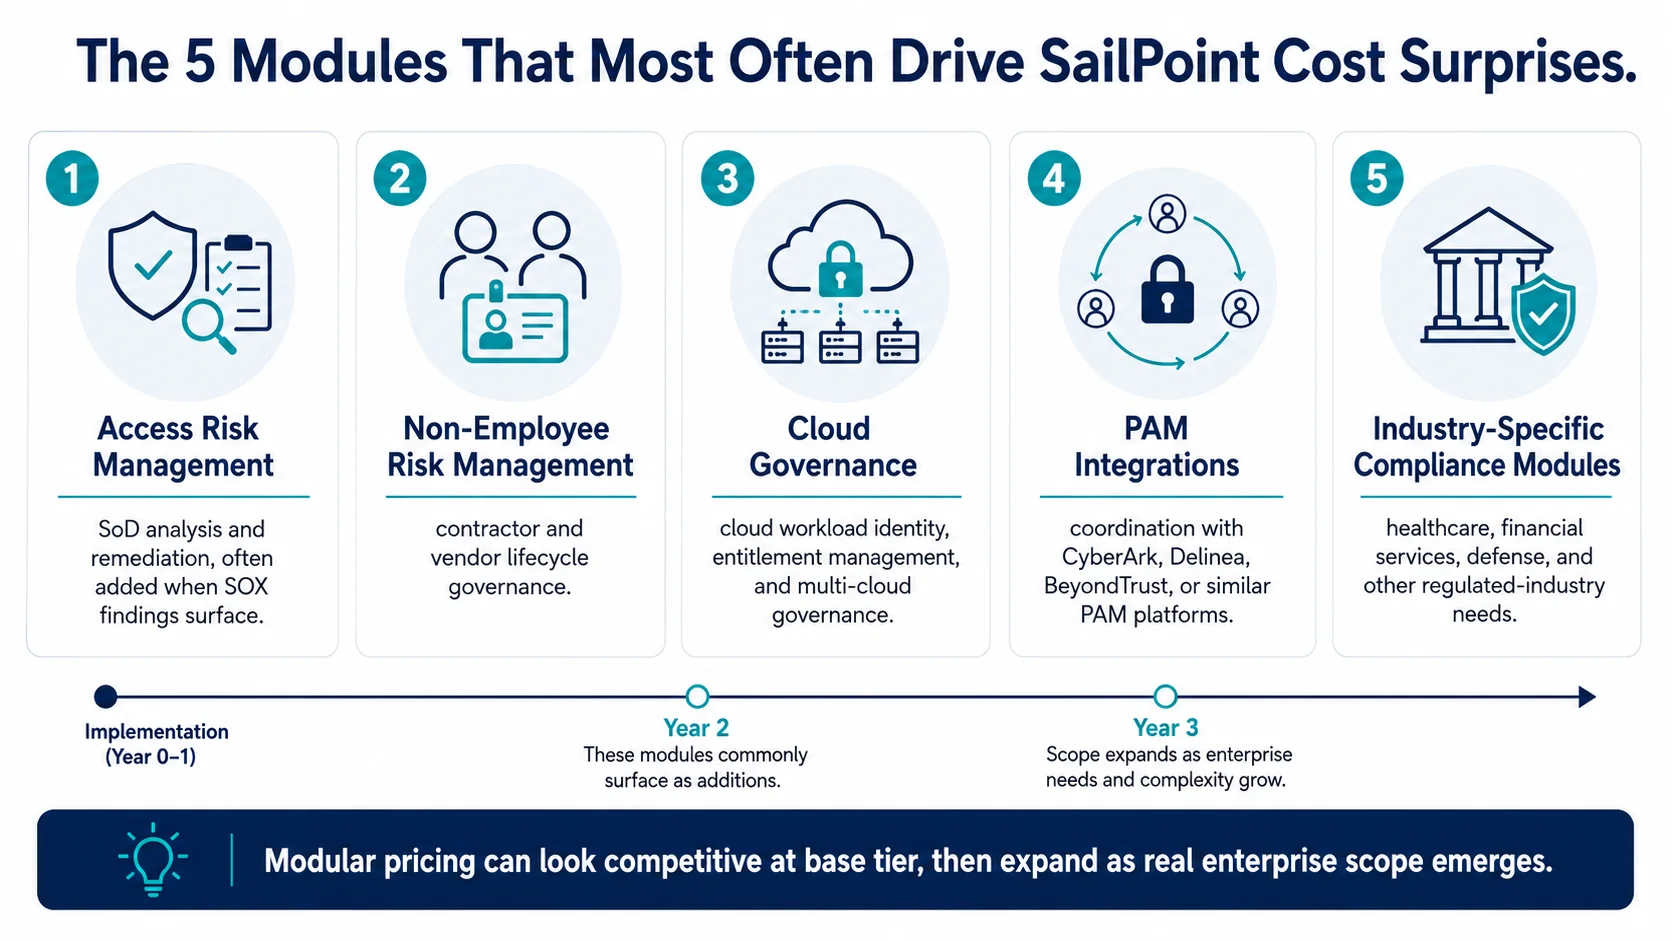
Enterprise IAM buyers evaluating SailPoint against Avatier are comparing two fundamentally different pricing philosophies — modular per-capability pricing with premium tiers and per-connector charges versus all-inclusive licensing that bundles the same capability set into the base license. The 2026 enterprise reference on the structural pricing differences, the modules that drive most of the SailPoint cost surprises, the Avatier all-inclusive positioning, and the buyer-side comparison discipline that produces defensible vendor selection instead of feature-checklist theater.
Login Reset Licensing Models: The 2026 Enterprise Cost Structure Reference
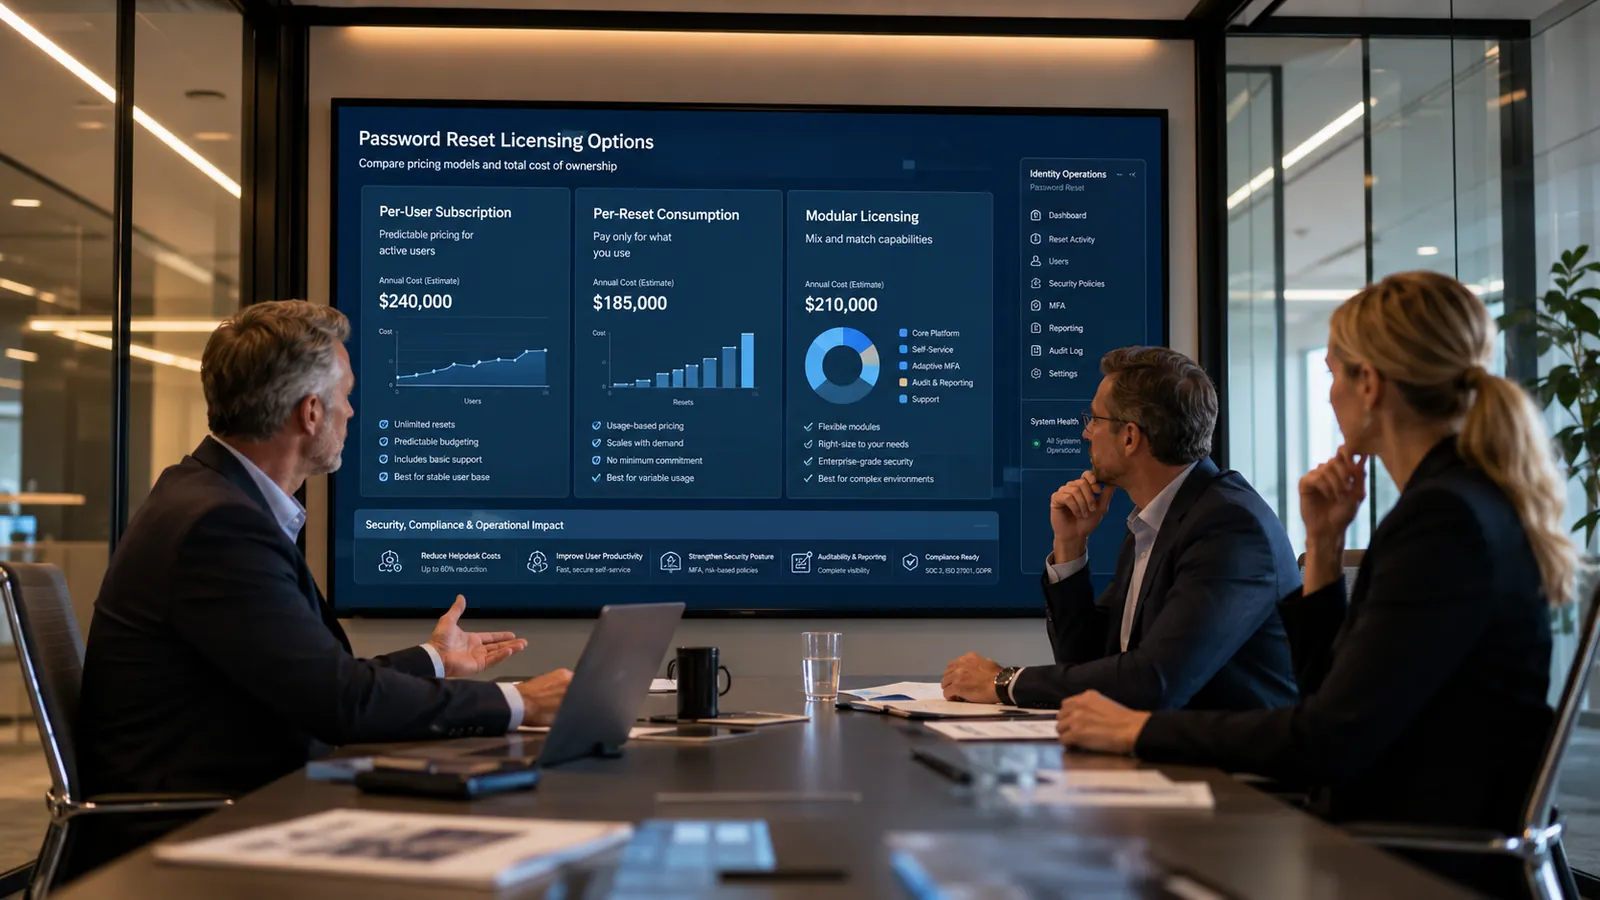
Enterprise password reset licensing has three fundamentally different pricing models — per-user subscription, per-reset-event consumption, and modular capability-based licensing — and the fit between model and buyer profile determines whether TCO tracks the vendor's list-price projection or surprises 18-24 months into deployment. The 2026 enterprise reference on the three licensing models, the specific line items that drive cost variance, and the buyer discipline that produces defensible reset-workflow vendor selection.