Measuring Security Culture: The KPIs That Matter in 2026
How organizations measure and improve security culture in 2026: leading vs. lagging indicators, behavioral KPIs, identity hygiene signals, survey instruments, and how to actually move the numbers.
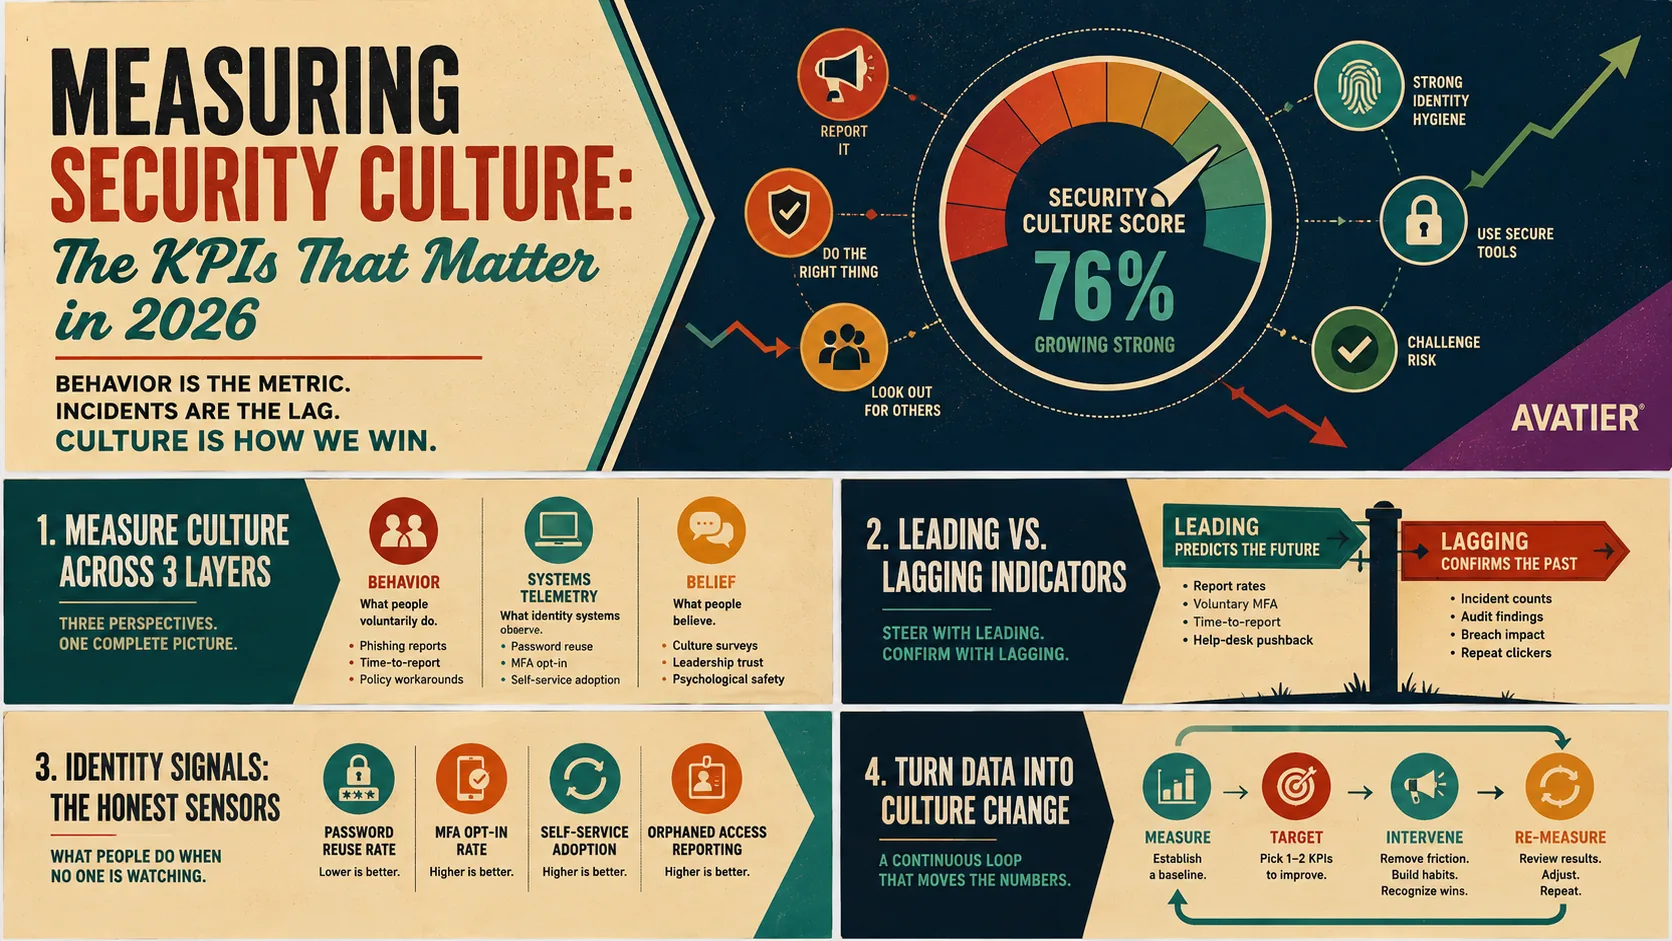
How organizations measure and improve security culture in 2026: leading vs. lagging indicators, behavioral KPIs, identity hygiene signals, survey instruments, and how to actually move the numbers.
- Organizations measure security culture by instrumenting three layers together: what people do (behavioral KPIs like phishing report rates and policy workarounds), what identity systems observe (password reuse, MFA opt-in beyond mandate, self-service adoption), and what people believe (structured culture surveys). They improve it by running a measure → target → intervene → re-measure loop instead of an annual awareness campaign.
- Leading indicators — report rates, voluntary MFA enrollment, time-to-report, help-desk verification pushback — predict incidents you have not had yet. Lagging indicators — incident counts, audit findings, breach impact — confirm what culture already was months ago. Most dashboards over-weight lagging indicators because they are easy to count, which is precisely why they fail to steer anything.
- Identity infrastructure is the most honest culture sensor an enterprise owns. Password reuse rates, MFA opt-in where it is optional, self-service password reset adoption, and orphaned-access reporting are measured continuously, resist gaming, and reflect what people actually do when nobody is watching — unlike training completion, which reflects what people do when compliance is watching.
- Security culture KPIs are the broader superset of training KPIs. Training metrics ask whether a program changed specific behaviors it taught; culture metrics ask whether the organization defaults to secure behavior everywhere, including situations no training module covered. Conflating the two produces dashboards that celebrate completion rates while the org routes around controls.
- KPIs bound what you can know: they capture behavior frequency, not motive, and a green dashboard can coexist with a workforce that fears reporting its own mistakes. Treat the numbers as instruments for steering interventions — never as proof that culture work is finished.
How do organizations measure and improve security culture? The ones that do it well instrument three layers at once: what people do (behavioral KPIs like phishing report rates and time-to-report), what identity systems observe (password reuse, voluntary MFA enrollment, self-service adoption), and what people believe (structured, anonymous culture surveys). Then they improve it by running those measurements as a loop — baseline, target, intervene, re-measure — rather than as an annual awareness campaign with a completion certificate at the end.
That answer sounds obvious written down. Almost nobody's dashboard reflects it. The typical "security culture" scorecard is a training-completion percentage, a phishing click rate, and an incident count — one compliance metric, one metric people learn to game, and one metric that tells you what your culture was two quarters ago. This piece is about replacing that scorecard with one that predicts, and about the uncomfortable discipline of actually moving the numbers.
This is the 2026 update of our original piece on measuring security culture through KPIs, rewritten for the current landscape: identity systems that now generate richer behavioral telemetry than any survey, AI-assisted phishing that has reset what "recognizable" means, and boards that have started asking culture questions with the same evidence expectations they apply to financial controls.
What security culture actually is — and why activity metrics don't measure it
Security culture is the sum of what people in your organization do about security when no one is checking. Not what the policy says, not what the training taught, not what people answer on a quiz — what they default to under deadline pressure, in ambiguous situations, in the gap between what the control anticipated and what the day delivered. Does the finance analyst pause on the urgent wire-transfer email, or execute it? Does the engineer report the credential they accidentally committed, or quietly rotate it and hope? Does the manager challenge the access request that looks slightly off, or approve it to keep the project moving?
None of those moments appear on an activity dashboard. Activity metrics — training modules completed, newsletters sent, posters hung, awareness-month events held — measure the security team's output, not the organization's culture. They are the metrics equivalent of measuring a sales team by calls dialed. The distinction matters because activity metrics saturate: a mature program reaches near-total training completion and then has nowhere to go, while the behaviors that determine breach outcomes remain unmeasured underneath the green dashboard.
Measuring culture, then, means measuring defaults. The rest of this piece is a tour of the instruments that actually do that — behavioral KPIs, identity telemetry, and surveys — and the loop that turns their readings into change.
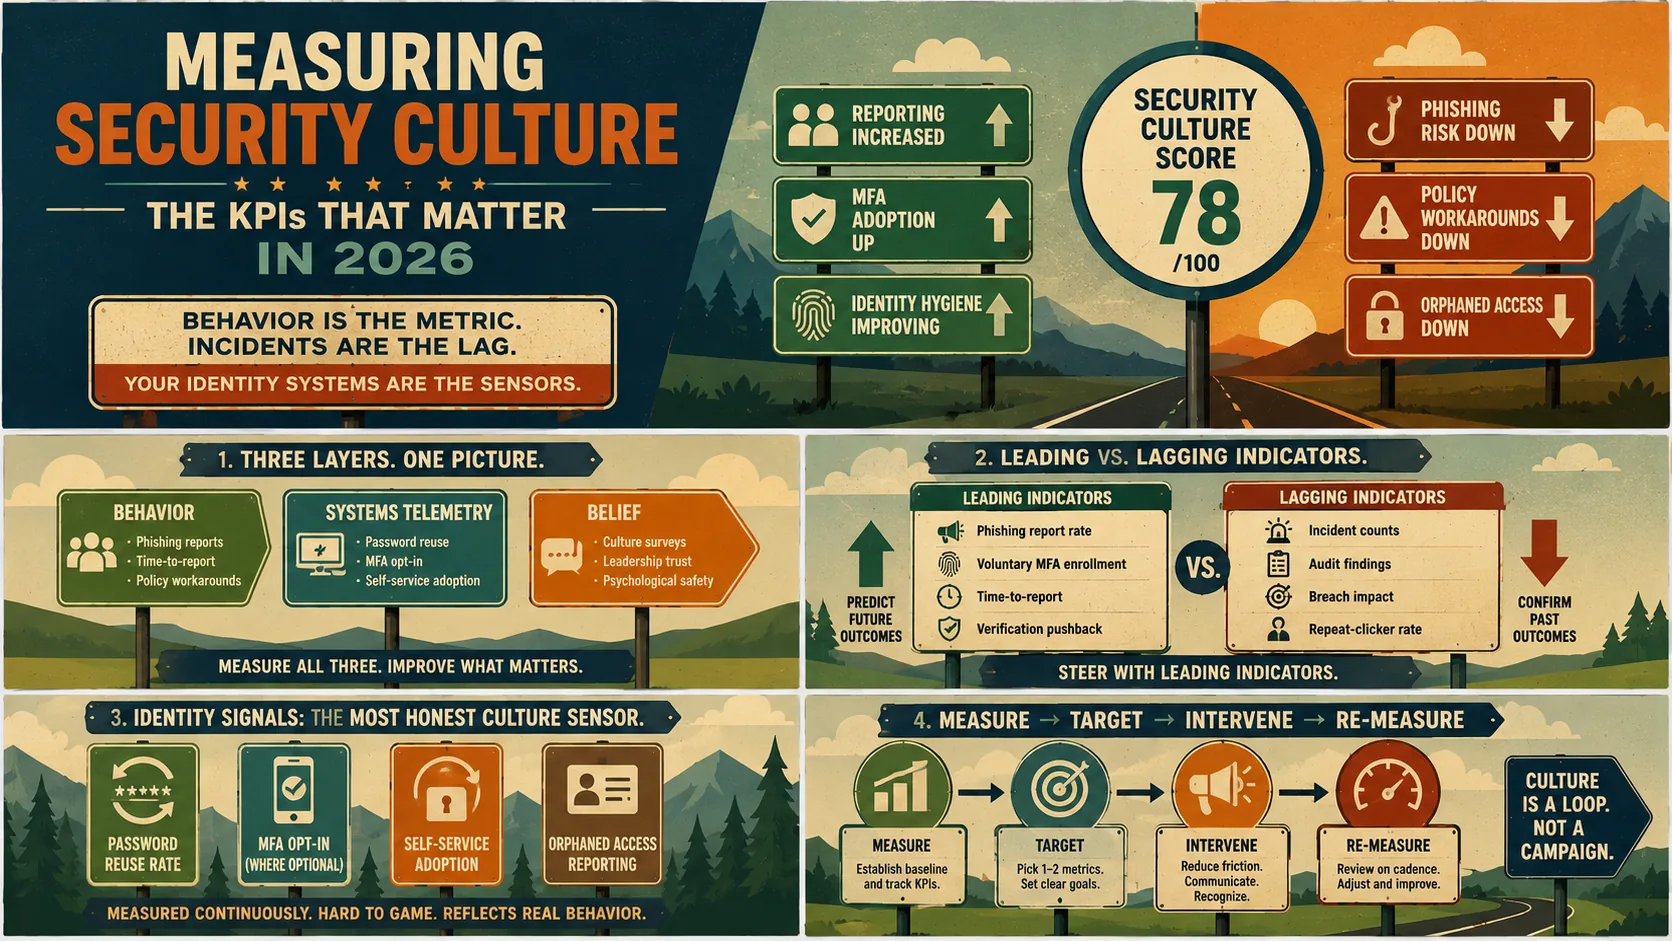 Behavior is the metric, incidents are the lag — and the identity systems you already run are the sensors reading the behavior.
Culture KPIs vs. training KPIs: two instruments, one common confusion
Before building the KPI set, draw one boundary clearly, because conflating these two disciplines wrecks both dashboards.
Security awareness training KPIs answer a program-scoped question: did this training change the specific behaviors it taught? Completion, knowledge retention, and — if the program is serious — post-training deltas in credential-handling and access-request behavior. That discipline has its own reference on this blog: security awareness training KPIs for identity programs, which covers the telemetry integration that makes training measurement honest.
Security culture KPIs answer the superset question: does this organization default to secure behavior everywhere — including the situations no training module covered, the systems no campaign mentioned, and the moments when the secure choice costs the employee something? Culture measurement therefore reaches for instruments training measurement never touches: voluntary tool adoption, workaround rates, reporting psychology, leadership signaling, and hygiene telemetry from identity systems.
The relationship is strict containment. Training metrics are one input into culture measurement, the way a thermometer is one input into a weather model. An organization can post immaculate training numbers while its culture metrics reveal a workforce that completes modules on time and then shares credentials in a team channel — because the training measured knowledge and the culture ran on incentives. If your dashboard cannot distinguish those two organizations, it is a training dashboard wearing a culture label.
Leading vs. lagging indicators: the axis your dashboard is probably missing
Every security culture metric sits somewhere on one axis: does it predict outcomes you have not had yet, or confirm outcomes you already had?
Lagging indicators are the familiar ones: incident counts, successful phishing compromises, audit findings, policy violations discovered in access reviews, breach impact when the bad quarter arrives. They are trustworthy — an incident is a fact — but they are slow. A lagging indicator describes the culture you had months ago, filtered through luck. An organization can run a weak culture for years and post clean lagging numbers because no attacker happened to test it seriously.
Leading indicators measure the behaviors that produce those outcomes: phishing simulation report rates (distinct from click rates — more below), time-to-report for real suspected incidents, voluntary MFA enrollment, help-desk verification pushback (how often staff challenge an unverified caller), self-service tooling adoption, and near-miss reporting volume. They move within weeks of a real culture shift, which makes them steerable — and gameable, which is why they need the lagging set as an annual honesty check.
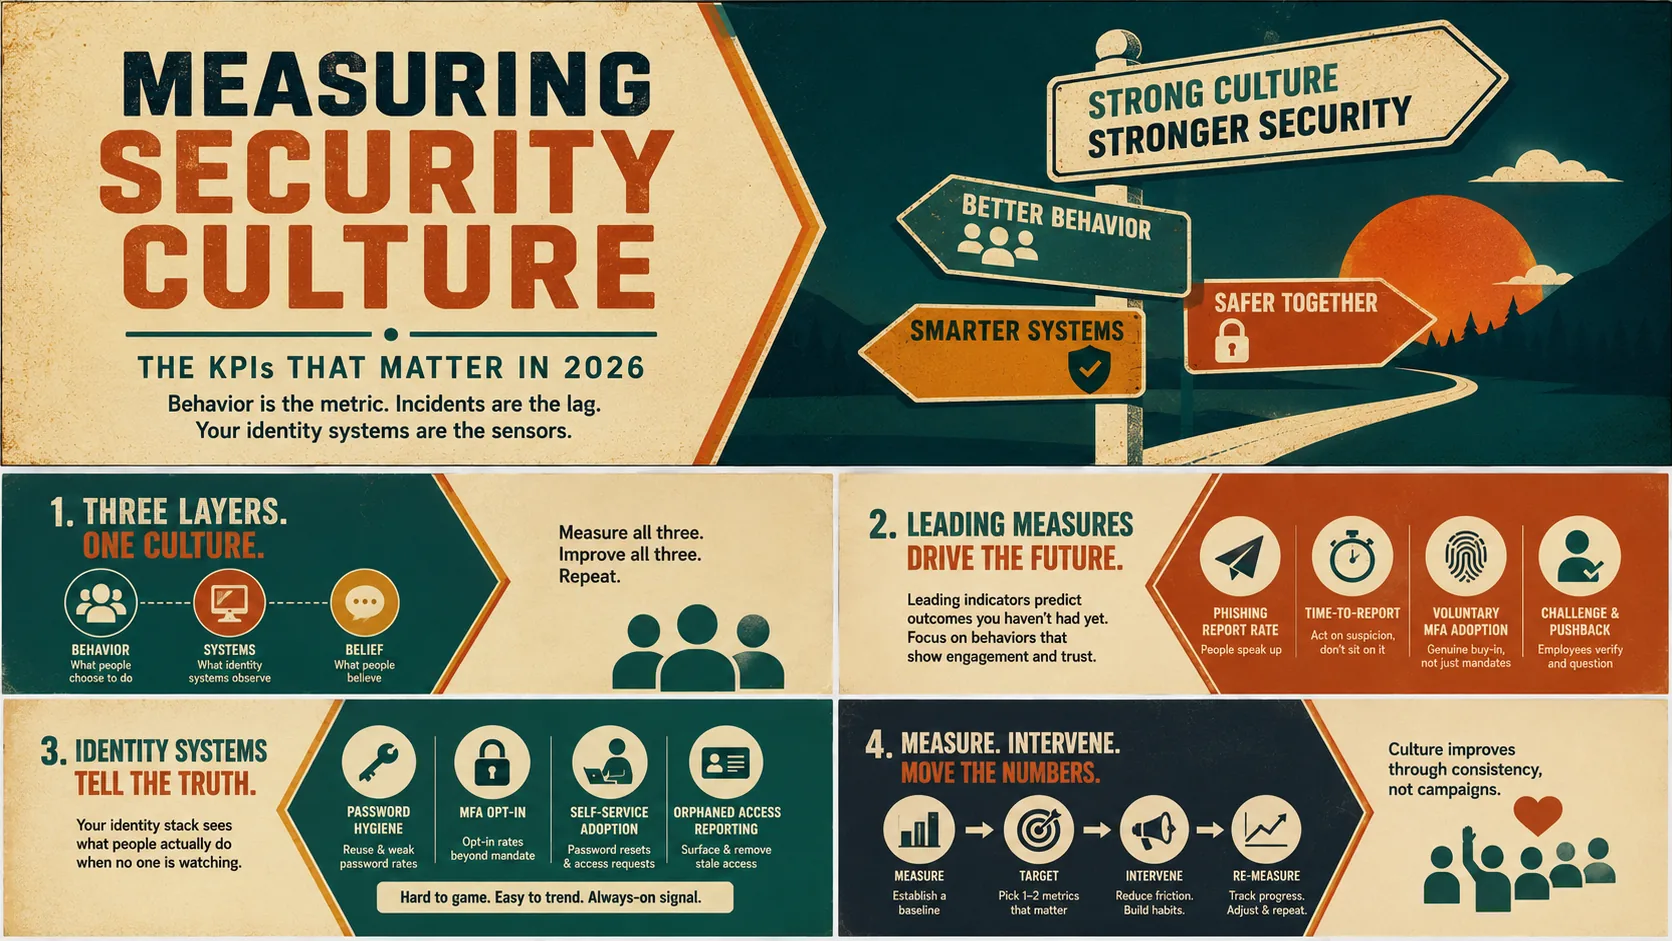 Leading indicators steer the program week to week; lagging indicators audit the leading set once a year. Most dashboards only have the right column.
Most dashboards over-weight the lagging column for an unglamorous reason: lagging indicators are easy to count and nobody disputes them. But a dashboard that only confirms the past cannot steer anything. The working ratio for a culture scorecard is roughly two-thirds leading, one-third lagging — with the explicit understanding that the lagging third exists to validate, annually, that your leading indicators still predict real outcomes in your environment rather than having been optimized into decoration.
The behavioral KPI set: measuring what people voluntarily do
The strongest behavioral KPIs share one property: the measured behavior is optional. Mandated behavior measures enforcement; optional behavior measures culture.
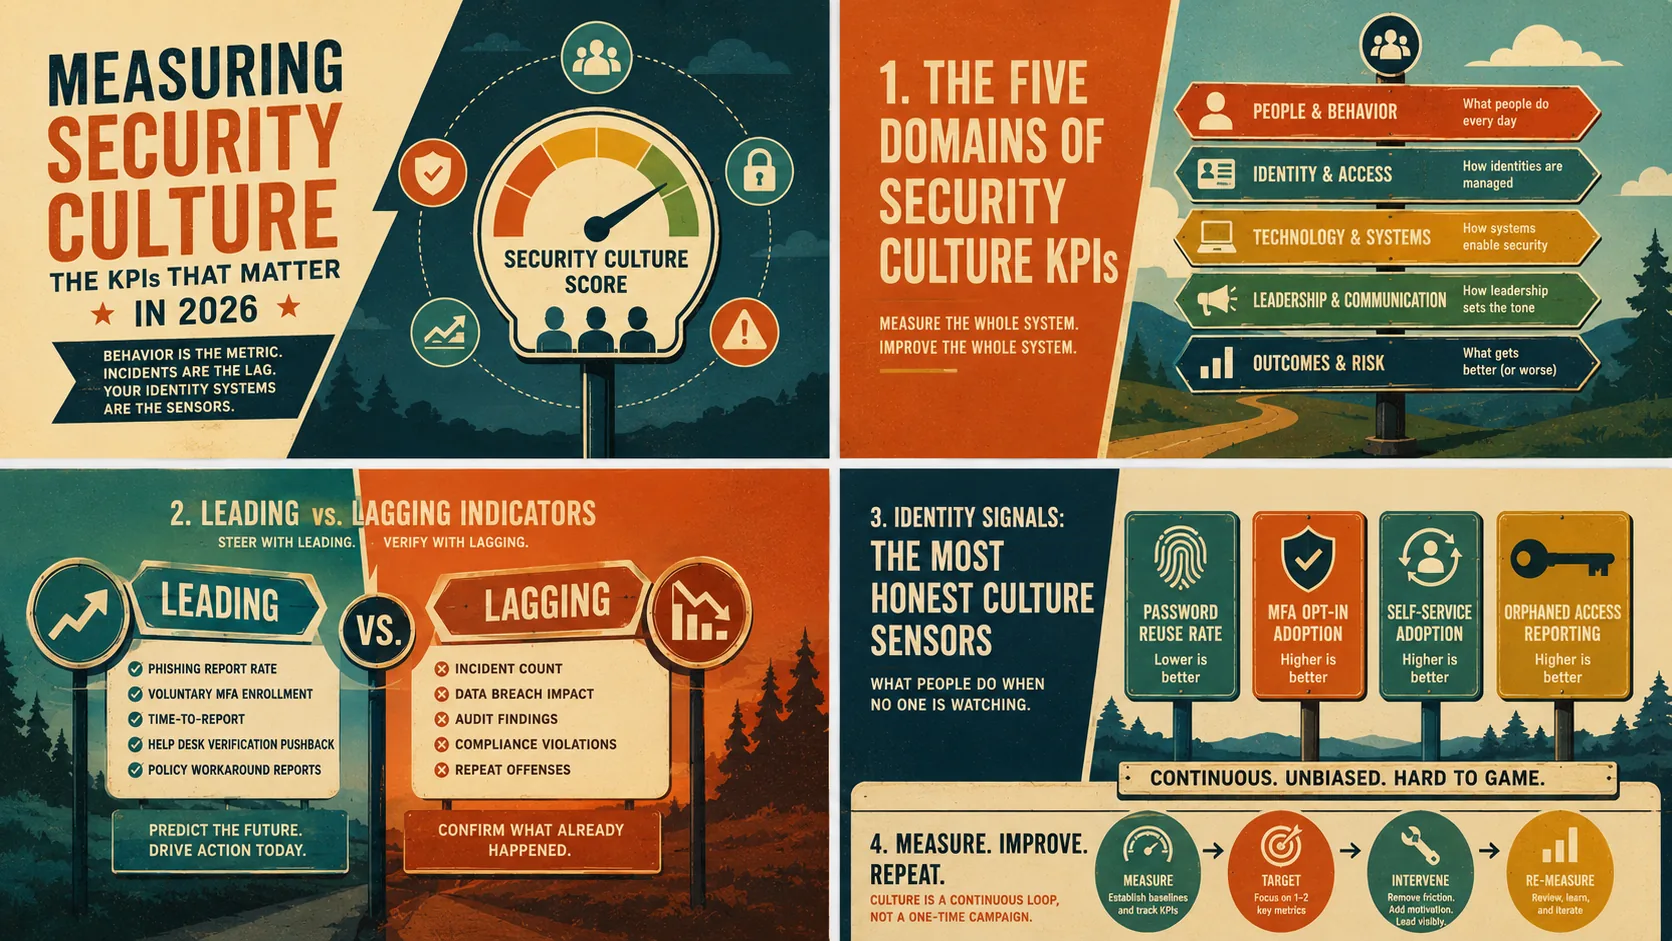 Culture spans five domains, not one. Measuring only the people layer misses the leadership signals and identity outcomes that shape it.
Phishing report rate, not click rate. Click rate is the industry's favorite phishing metric and its most gameable: it declines as employees learn to recognize the simulation vendor's templates, which is pattern-matching, not vigilance. Report rate — the share of recipients who actively flag the simulation — measures something optional and effortful. An employee who deletes a suspicious email has protected themselves; an employee who reports it has protected the organization. The gap between those two behaviors is the culture gap. Track report rate on simulations, and track it separately on real phish that reach inboxes, because the second number is the one that shortens incident response.
Time-to-report. When someone suspects a compromise — a clicked link, a lost device, a credential typed into the wrong page — how long until security knows? This is the metric that most directly converts culture into incident-response capability, and it is driven almost entirely by fear. People report fast when reporting is safe and slow when reporting is punished. A falling time-to-report is among the clearest evidence that psychological safety is real rather than aspirational.
Workaround rate. Every shadow-IT subscription, shared credential, and forwarded-to-personal-email document is a vote against the sanctioned path. Some of this is measurable directly (cloud-access logs, DLP events, expense reports); some arrives via survey ("in the last month, did you work around a security control to get your job done?" — anonymously, people answer honestly). Rising workaround rates are rarely a discipline problem. They are a signal that the secure path costs too much, and the fix is usually friction engineering, not enforcement. A password policy that drives predictable-pattern coping, for instance, is manufacturing its own workarounds — the mechanics are covered in our reference on enterprise password policy.
Verification pushback. How often do employees challenge unverified requests — the caller claiming to be IT, the "CEO" needing gift cards, the colleague asking for a password "just this once"? Help-desk verification refusals and reported pretexting attempts are countable, and they measure the single behavior that defeats most social engineering: the willingness to make an interaction slightly awkward in exchange for making it safe.
Identity hygiene signals: your IAM stack is a culture sensor
Here is the measurement asset most culture programs ignore: the identity infrastructure is already logging culture, continuously, at population scale, in a form that resists gaming — because it records what people do when nobody is testing them.
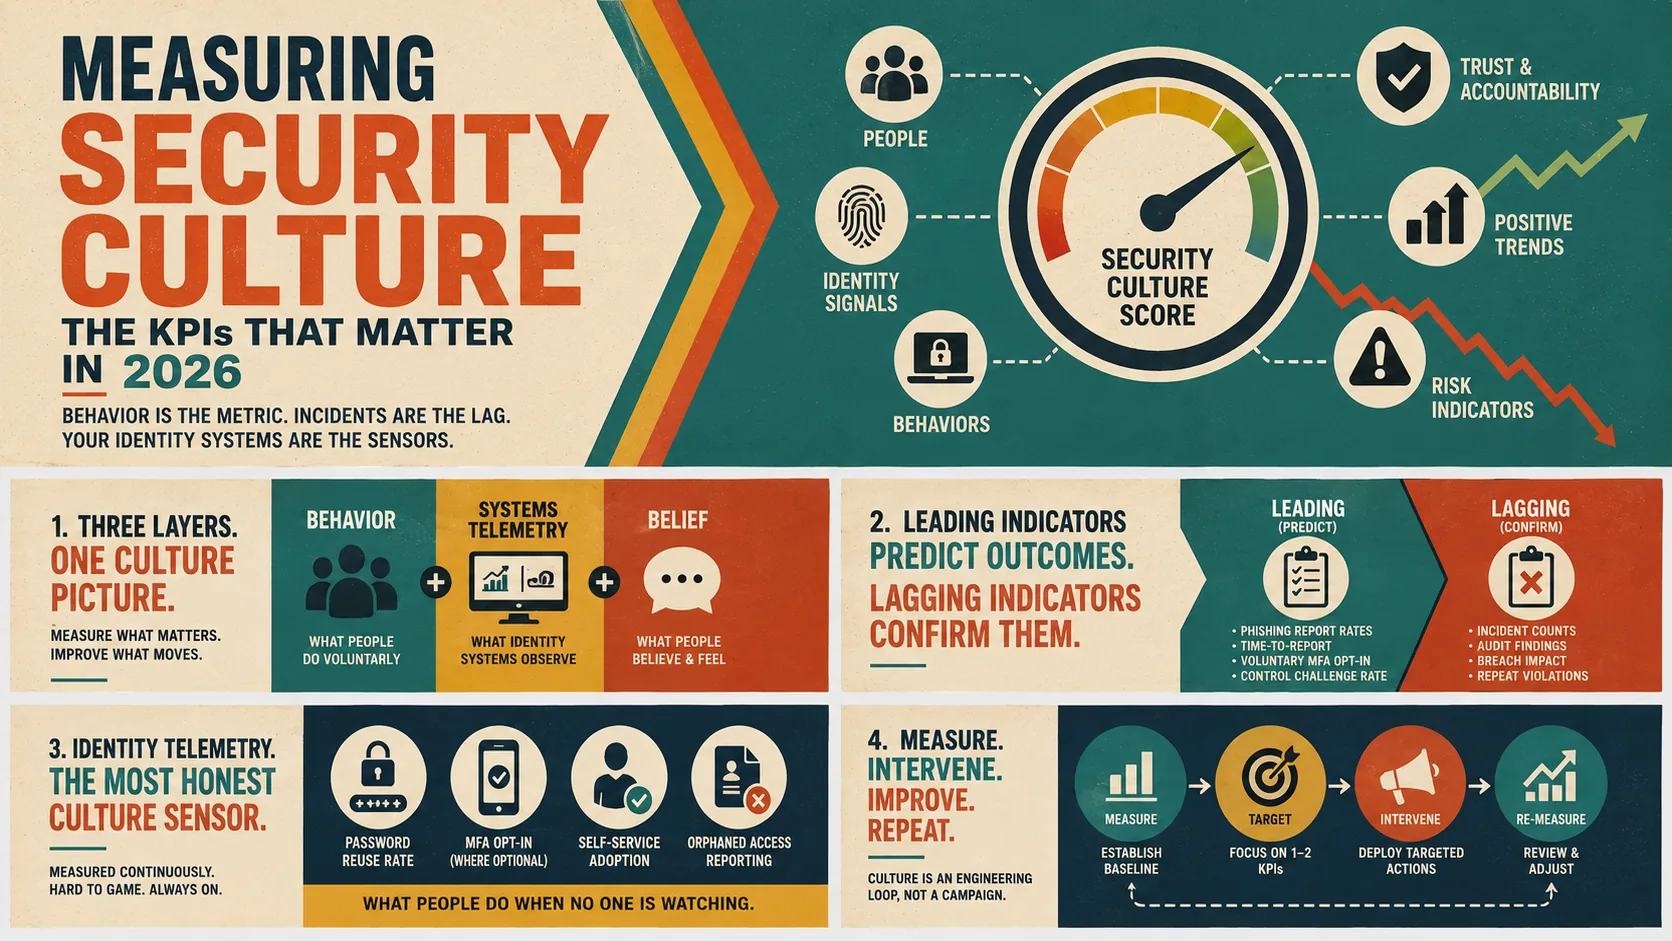 Password reuse, voluntary MFA, self-service adoption: continuous, population-scale, and measuring behavior when no one is testing it.
Password reuse and weak-credential rates. Screening authentications and password changes against breached-credential corpora yields a direct, continuous hygiene measurement: what fraction of the workforce is reusing known-compromised or trivially weak credentials right now? This is culture rendered as telemetry — guidance everyone has heard, measured at the moment of private choice. The trend line matters more than the level, and a falling reuse rate is one of the few metrics that mechanically reduces account-takeover exposure while it improves. The underlying risk arithmetic is covered in the risks of weak passwords.
Voluntary MFA enrollment. Where MFA is mandated, enrollment measures enforcement. Where it is offered — optional step-up, opt-in passkeys, additional factors beyond the minimum — enrollment measures belief. The share of employees who enroll a stronger factor when nothing forces them to is as close to a direct reading of security buy-in as identity data provides. Watch it by department: uneven voluntary adoption maps the subcultures inside your culture.
Self-service adoption. The ratio of self-service password resets and access requests to help-desk equivalents measures whether employees engage with sanctioned tooling or route around it. It is also a friction gauge: when self-service adoption stalls, the cause is almost always experience, not attitude — and fixing the experience moves the culture metric. This is a case where the intervention and the measurement live in the same system.
Employee-initiated governance signals. Access anomalies reported by employees and managers — "I still have access to my old team's finance folder" — versus anomalies surfaced only by audit. A workforce that volunteers its own excess access is exhibiting the exact ownership behavior every culture program claims to want, and access-review telemetry records it. Where review decisions feed compliance evidence — SOX being the canonical case — decision quality in certifications doubles as a culture reading on the manager population; our piece on SOX compliance for identity teams covers what those artifacts need to look like.
One honest caveat: identity telemetry measures behavior frequency, not motive. It cannot distinguish the employee who adopted a password manager from conviction from the one who did it because a colleague nagged them. For motive, you need the third instrument.
Survey instruments: measuring what the telemetry can't
Surveys are the only instrument that reaches beliefs — and beliefs are where the next year's behaviors come from. A serious culture survey measures four things: knowledge (do people know what to do), attitude (do they think it matters), perceived organizational commitment (do they believe leadership means it), and psychological safety (do they believe reporting a mistake is safe). The fourth dimension is the one most programs skip and the one that predicts time-to-report better than any other question you can ask.
Design constraints that separate signal from theater: anonymity that employees actually believe (aggregated results, minimum group sizes); question stability year over year so trends are real; results published back to the workforce with named actions; and a cadence that respects attention — a full instrument annually or semi-annually, short rotating pulse checks in between. Benchmark against yourself, not against vendor percentile charts; your trend line under a stable instrument is the only comparison that is methodologically clean.
The survey's highest-value output is not the average score. It is the variance — the department where psychological safety reads two points below the org, the site where perceived leadership commitment cratered after a reorg. Culture is local; averages launder the signal.
Moving the numbers: the improvement loop
Measurement without an improvement loop is surveillance. The loop is unglamorous and it is the entire mechanism:
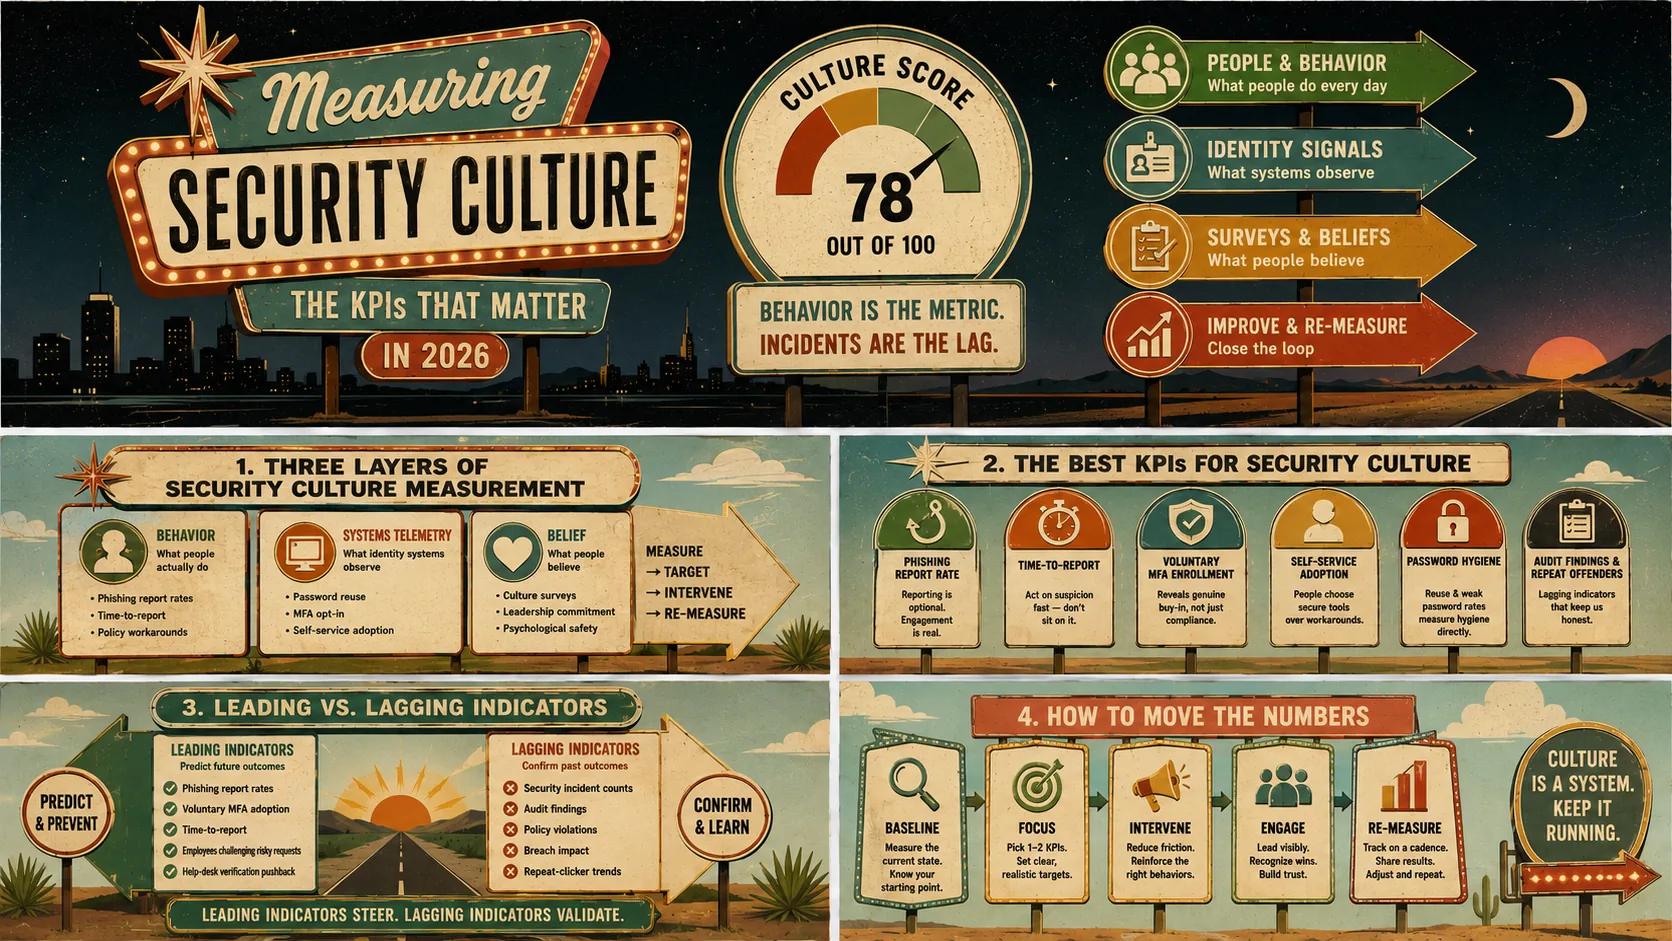 Baseline, pick one or two metrics, intervene, re-measure on a cadence. Culture is a system you keep running, not a campaign you launch.
Measure. Establish the baseline across all three layers — behavioral, identity telemetry, survey. Resist the urge to fix anything for one full cycle; an untrusted baseline poisons every later comparison.
Target. Pick one or two metrics per cycle, each with a named owner and a realistic delta. "Raise phishing report rate" beats "improve culture." Programs that target everything move nothing.
Intervene — with mechanisms, not messaging. The interventions that reliably move behavioral KPIs cluster into three families. Friction reduction: make the desired behavior the cheap behavior — a one-click report button, self-service reset that works the first time, MFA enrollment that takes two minutes. Recognition: make the desired behavior visible and celebrated — thank reporters personally, publicize catches (including near-misses), and never punish the employee who reports their own mistake, because one punished reporter re-teaches the whole floor to stay silent. Leadership modeling: executives visibly subject to the same controls — the CFO using the same MFA ceremony as everyone else moves the perceived-commitment survey score more than any newsletter.
Re-measure on a fixed cadence. Quarterly for behavioral and telemetry metrics, annually for the survey. Publish the delta either way. A program that only reports good quarters is a program the workforce has already stopped believing.
Two loop pathologies to guard against. First, metric fixation: any single number pursued long enough gets gamed — rotate emphasis across the KPI set and let the lagging indicators audit the leading ones annually. Second, intervention sprawl: shipping five interventions at once means learning nothing about which one worked. One or two per cycle, measured properly, compounds; where your organization sits on the identity maturity model largely determines how fast the loop can turn, because mature identity operations generate cleaner telemetry with less manual effort.
What Avatier ships toward this pattern
Avatier's position on culture measurement follows directly from the friction argument above: you cannot measure voluntary secure behavior if the secure path is so painful that nobody volunteers. Avatier Identity Anywhere is built to make the sanctioned path the cheap path — self-service password reset and access requests from any device, MFA enrollment designed to take minutes, mobile approvals that let managers make real access decisions without a desktop session — and then to report the adoption of those paths continuously. That gives security teams the identity-telemetry layer of this piece as a byproduct of operations: reset and request self-service ratios, MFA enrollment coverage, certification completion and decision quality, and lifecycle events that show whether deprovisioning discipline is holding. For workforces where a personal phone cannot be assumed — manufacturing floors, clinical environments, shared workstations — deviceless FIDO2-compatible authentication via Identity Challenge Card removes the hardware excuse from the MFA-adoption metric entirely.
The compliance posture behind the platform is public at the Avatier Trust Center: SOC 2 Type II audited with zero exceptions noted, ISO/IEC 27001:2022 certified, PCI DSS v4.0.1 compliant, CSA STAR Level 1 attestation, NIST 800-53 Rev. 5 aligned, and a CISA Secure-by-Design Pledge signatory. Publishing evidence rather than claims is the vendor-side version of the discipline this piece asks of culture programs.
What the KPIs do not capture
End with the limits, because a culture program that mistakes its dashboard for its culture has already failed in the most modern way possible.
KPIs capture frequency, not motive. The telemetry cannot tell you whether the falling password-reuse rate reflects conviction or a browser update that made the password manager default. Two organizations with identical dashboards can carry very different cultures underneath — one resilient, one brittle — and the difference only shows when something the metrics never anticipated goes wrong.
KPIs are silent about the tails. Culture fails at the margins: the contractor nobody enrolled, the acquisition still on its own stack, the executive assistant with delegated everything. Population-level metrics average those margins away, and attackers do not attack the average.
Surveys measure what people are willing to say; behavior metrics measure what systems can see. The space between — quiet fear, private cynicism, the near-miss nobody mentioned — is exactly where the next incident is incubating, and no instrument in this piece reaches it directly. The closest proxy you have is the trend in voluntary reporting, which is why this piece keeps returning to it.
So hold the numbers the way a good engineer holds any telemetry: as instruments for steering, never as proof of arrival. Measure the three layers, run the loop, publish the deltas, and stay suspicious of your own green dashboard. That suspicion, institutionalized, is the closest thing to a security culture KPI that cannot be gamed.
ABOUT THE AUTHOR

More from IAM & Identity Governance
AI-Driven Identity Risk Scoring in 2026: The Enterprise Reference
AI-driven identity risk scoring turns authentication, entitlement, and behavior signals into a live per-identity risk number that drives step-up auth, reviews, and revocation. The 2026 reference.

Industries That Need Identity Management Most in 2026
Eight industries carry regulatory or operational pressure that makes identity governance non-optional — and manufacturing has quietly become the hardest of them. The 2026 refresh maps each sector's identity problem, its frameworks, and the state-level mandates (TX-RAMP, StateRAMP, privacy acts) now underneath all of them.
Zero Trust Metrics: How to Measure Zero Trust Success in 2026
The 2026 reference on zero trust metrics: the five measurement domains, the identity KPIs that predict blast radius, maturity checkpoints, and the numbers that mislead.