Zero Trust Metrics: How to Measure Zero Trust Success in 2026
The 2026 reference on zero trust metrics: the five measurement domains, the identity KPIs that predict blast radius, maturity checkpoints, and the numbers that mislead.
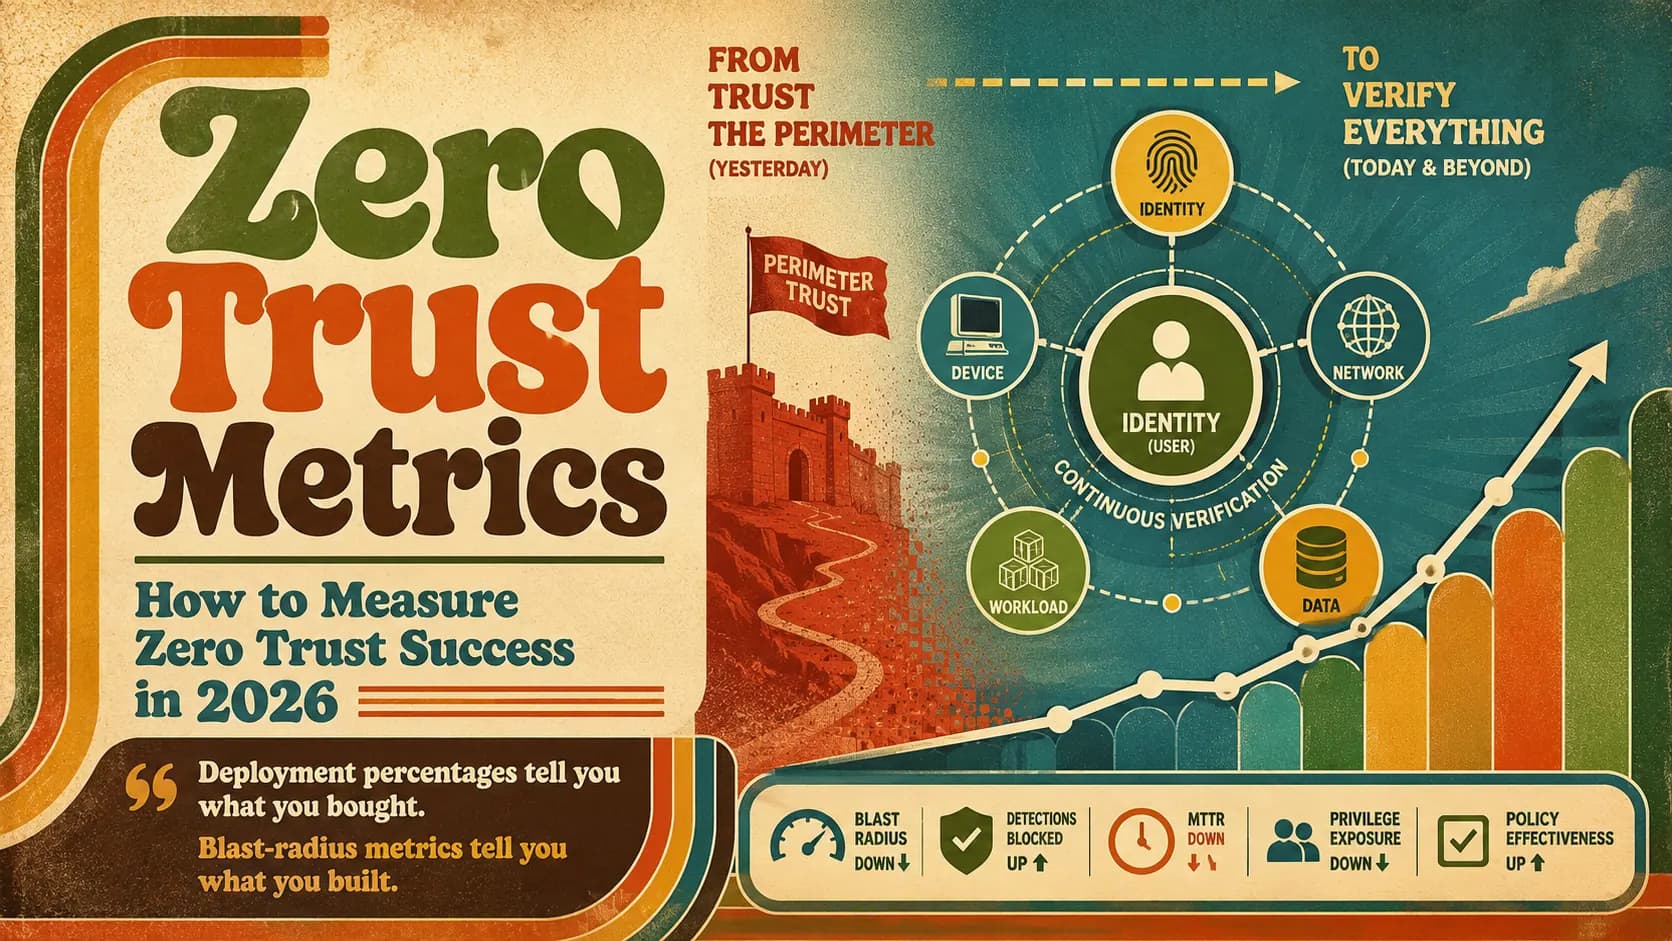
The 2026 reference on zero trust metrics: the five measurement domains, the identity KPIs that predict blast radius, maturity checkpoints, and the numbers that mislead.
- Zero trust metrics are the quantitative evidence that a zero-trust program is reducing implicit trust — not evidence that products were deployed. The useful ones measure outcomes attackers care about: how much standing access exists, how fast it dies when it should, and how often verification actually happens per access decision.
- Measurement organizes into five domains that mirror the NIST SP 800-207 view of the estate: identity, device, network, workload, and data. Identity is the highest-signal domain because nearly every modern intrusion rides a credential, and identity metrics are the cheapest to instrument from systems you already run.
- The four identity KPIs that predict blast radius: standing-privilege reduction (how much always-on access remains), MFA and passwordless coverage measured against all authentication events rather than enrolled users, time-to-revoke for leavers and compromised credentials, and just-in-time adoption for privileged work.
- Maturity is a curve, not a checkbox: perimeter trust → identity-centric controls → context-aware policy → continuous verification. Each stage has measurement checkpoints, and skipping the baseline stage is the most common reason programs cannot demonstrate progress a year later.
- Metrics do not capture everything. Deployment percentages, blocked-attack counts, and tool tallies flatter the program without describing risk — and no dashboard measures the assumption you forgot to test. Treat metrics as instruments on the panel, not the aircraft.
Zero trust metrics are the numbers that tell you whether "never trust, always verify" is actually happening — how much standing access remains in the environment, what fraction of access decisions get verified against identity and context, how fast access dies when it should. They are not deployment statistics. An enterprise can roll out every product on the zero-trust shopping list and still extend implicit trust everywhere it matters; the metrics exist to catch exactly that gap. This piece is the working reference for measuring a zero-trust program in 2026: the five domains worth instrumenting, the identity KPIs that predict blast radius, the maturity checkpoints, and the numbers that flatter a program without describing it.
This is the 2026 update of our original piece on measuring zero trust success, rewritten for the current landscape: passkeys moving from pilot to default, non-human identities outnumbering people, and boards that have stopped accepting "we bought the platform" as a status report.
Why zero-trust programs stall without measurement
Zero trust has a structural measurement problem that most security initiatives do not: it never finishes. A firewall deployment ends. An EDR rollout ends. Zero trust, as NIST SP 800-207 frames it, is an architectural posture — a continuous discipline of evaluating every access decision against identity, device, and context rather than network location. A program with no finish line needs instruments, because instruments are the only way to distinguish progress from motion.
The stall pattern is consistent across enterprises. Year one produces visible activity: an identity provider consolidation, an MFA push, a segmentation project. Year two, the budget conversation arrives and the program discovers it cannot answer the only question the CFO has — what did we get? Deployment percentages get presented, executives correctly intuit that deployment is not protection, and the program's political capital drains. The failure was not the architecture. It was that nobody baselined the implicit trust the program was supposed to remove, so there was no honest way to show it shrinking.
The fix is unglamorous: treat measurement as a deliverable of the program's first quarter, not a reporting chore bolted on at renewal time. Baseline first, instrument second, and let the architecture work proceed knowing exactly which numbers it is supposed to move.
The five metric domains of a zero-trust program
Zero trust spans the whole estate, and so does its measurement. The practical decomposition follows the same surfaces the architecture governs: identity, device, network, workload, and data. Five domains, each with a small set of metrics that describe whether implicit trust is actually being removed from that surface.
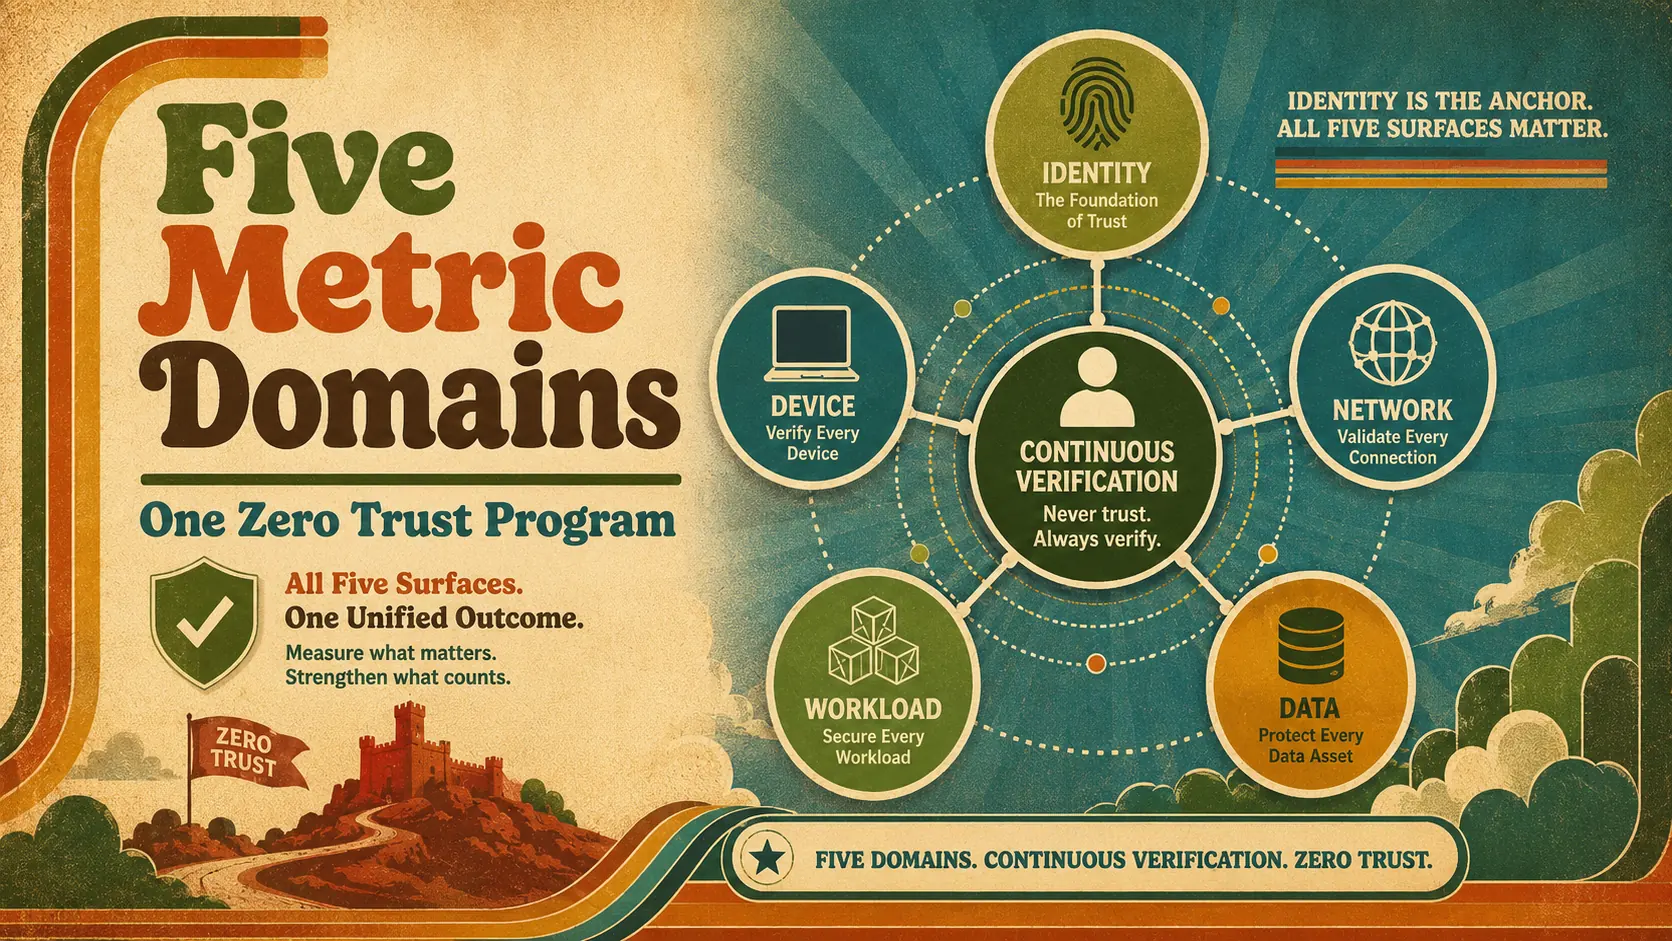 Five surfaces, one program. Identity anchors the set — but a program measuring only one surface is trusting the other four implicitly.
Identity is the anchor domain: standing privileged access counts, MFA and passwordless coverage, time-to-revoke, and just-in-time adoption. More on each below, because this domain deserves its own section.
Device measures whether the things authenticating are themselves verified: the share of authentication events originating from managed, posture-checked devices, and the share of access policies that actually evaluate device signals rather than ignoring them.
Network measures the death of the flat network: the fraction of east-west traffic subject to segmentation policy, and the share of application access delivered through identity-aware proxies or ZTNA rather than broad VPN tunnels that grant subnet-level reach after a single check.
Workload covers the non-human majority: the share of service-to-service calls authenticated with scoped, short-lived workload identities rather than shared secrets, and the count of long-lived static credentials still embedded in code and configuration — a number whose only acceptable trend is down.
Data measures the last mile: the fraction of classified data stores behind attribute-based access control, and how much sensitive data remains reachable through paths that skip the policy engine entirely.
Two observations from running this decomposition in practice. First, identity is the highest-signal domain per unit of instrumentation effort — nearly every modern intrusion rides a credential, and the identity metrics fall out of systems you already operate: the IdP, the IGA platform, the HR feed. Second, the domains are not independent. A perfect identity score means little if workload credentials are shared secrets with no expiry, which is why the dashboard needs all five panels even when the program invests unevenly across them.
The identity KPIs that predict blast radius
When an incident responder walks into a compromise, their first-hour questions are identity questions: what could this credential reach, was the access standing or elevated, how fast can we kill it, and was the authentication phishable? The best identity KPIs are those four questions, converted into standing instrumentation. This is also why identity metrics double as identity security posture management metrics — ISPM is, in large part, the tooling category that emerged to keep these numbers continuously observed instead of annually estimated.
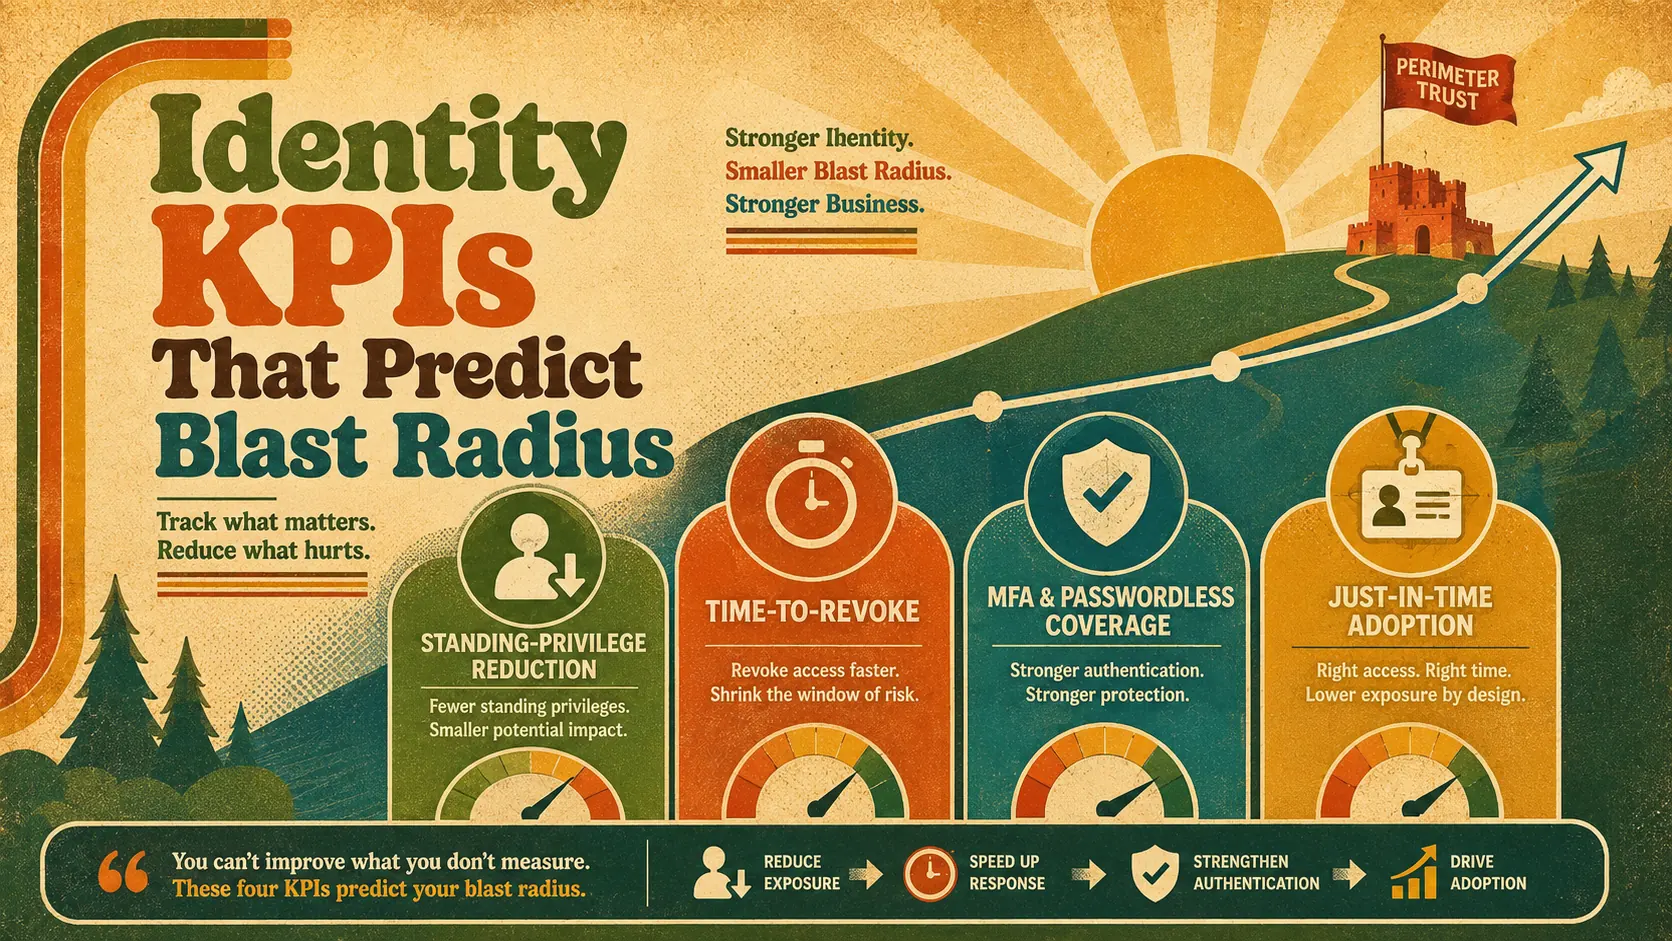 Four identity KPIs that move blast radius: fewer standing privileges, faster revocation, stronger authentication, time-bound elevation.
Standing-privilege reduction. Count the entitlements that are privileged and always on — admin accounts, broad database grants, standing production access — and drive the count down by moving that work to just-in-time elevation. This is the closest thing zero trust has to a blast-radius dial: every standing grant removed is reach a stolen credential no longer inherits. Measure it as an absolute count and as a trend, and pair it with its companion ratio, JIT adoption — the share of privileged sessions flowing through time-bound, approved, automatically-expiring elevation. The operational pattern behind both numbers is covered in our piece on just-in-time access and zero standing privilege, and the policy foundation in least privilege at enterprise scale.
MFA and passwordless coverage. The trap here is the denominator. Coverage measured against enrolled users produces comfortable numbers; coverage measured against all authentication events — including service accounts, legacy protocols, and the systems that quietly bypass the IdP — produces honest ones. Attackers authenticate through the unprotected fraction, so the unprotected fraction is the metric. In 2026 the bar has also moved within the metric: track phishing-resistant coverage (FIDO2, passkeys) as its own line, because a program whose MFA story is push notifications is measuring a control that social engineering already defeats. Deviceless workforces — manufacturing floors, clinical environments, shared workstations — are where this metric traditionally stalls, and closing that segment is the design problem behind Identity Challenge Card, which extends FIDO2-compatible authentication to workers with no phone to enroll.
Time-to-revoke. Two clocks, reported separately. The leaver clock: elapsed time from termination event to complete access removal across every connected system — not just the directory, every system. The incident clock: time from compromise signal to full session and credential kill. Both should be measured end to end, because per-system revocation numbers hide the long tail — the SaaS app nobody deprovisioned, the mainframe account on a different lifecycle. Enterprises that measure this honestly usually find the tail is where the exposure lives, which is precisely the finding that justifies the lifecycle-automation investment that fixes it.
Access-review integrity deserves an honorable mention as the fourth instrument: not certification completion percentage — which measures clicking — but revocation yield, the share of reviewed entitlements that actually got removed. A review cycle with near-zero yield is either governing a perfect environment or rubber-stamping; the base rates say it is not the first one.
Maturity signals: measuring the curve, not the checkbox
Metrics tell you where you are. A maturity model tells you where "where you are" is supposed to be — and which metrics are even worth collecting at your stage. The curve runs from perimeter trust (location equals trust, flat network, passwords) through identity-centric controls (centralized authentication, MFA, lifecycle automation) and context-aware policy (device posture and risk signals in the access decision) to continuous verification (per-session evaluation, JIT by default, automated response). NIST SP 800-207 describes the destination; the curve describes the climb.
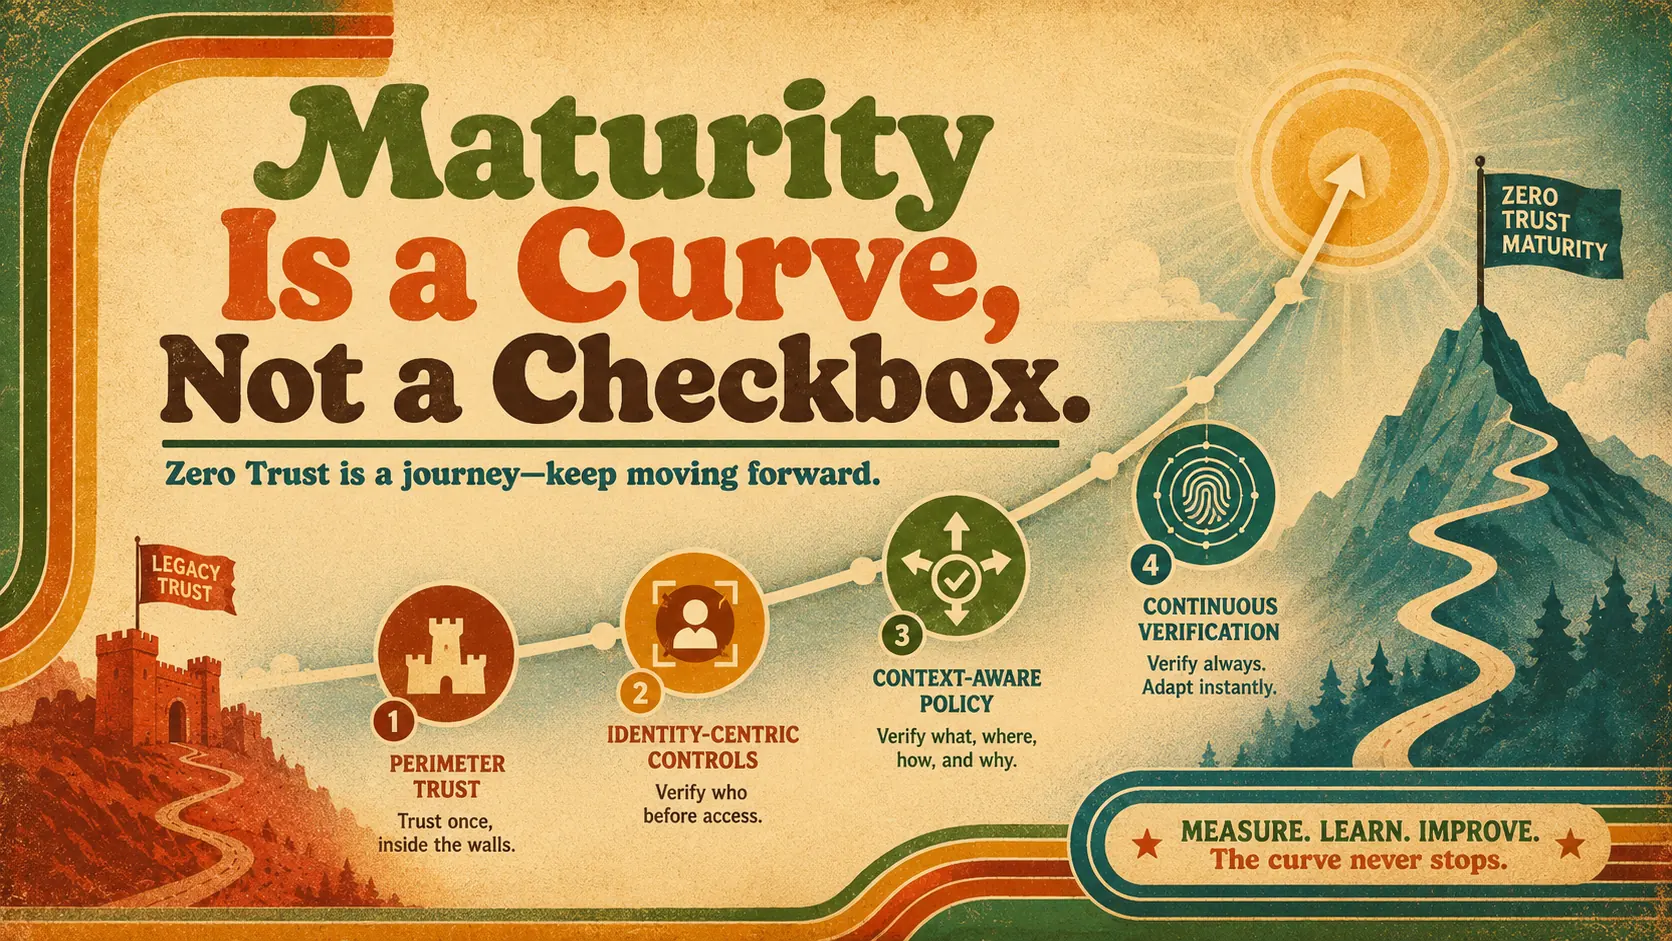 Each stage unlocks the next stage's instruments. Maturity is a curve you keep climbing, not a box you tick once.
Each stage transition has a measurement checkpoint. Leaving perimeter trust requires the baseline: the honest census of standing privilege, coverage gaps, and revocation lag that everything later is compared against. The identity-centric stage is where coverage metrics mature — authentication centralization, MFA denominators, lifecycle automation rates. The context-aware stage unlocks policy-quality metrics: what fraction of access decisions actually evaluate device and risk signals. Continuous verification is where the blast-radius and velocity metrics — standing privilege near zero, revocation in minutes — become the headline numbers.
Two practical notes on the curve. First, stage-skipping shows up in the metrics as incoherence: an enterprise reporting continuous-verification telemetry while its baseline shows hundreds of standing admin accounts is measuring the wrong stage, and auditors increasingly notice. The staging discipline is covered in depth in our identity maturity model reference. Second, the curve is not uniform across the estate — the cloud-native stack may sit at stage four while the mainframe estate sits at stage two, and honest reporting shows the distribution rather than the average. An average maturity score is how a program hides its riskiest systems from its own dashboard.
Building the measurement program
The mechanics are less interesting than the metrics but decide whether the metrics survive contact with the organization. Four moves, in order.
Baseline before you build. Capture the ugly numbers first — standing privileged accounts, real time-to-revoke, true MFA denominators, ungoverned system count — and date-stamp them. The baseline is the program's most valuable artifact: every future claim of progress is a comparison against it, and it cannot be reconstructed later. Programs that skip this step spend year two explaining why they cannot demonstrate improvement they genuinely achieved.
Set directional targets, not fantasy ones. "Standing privilege down 30% by Q4" beats "zero standing privilege" as a target, because the first one gets managed and the second one gets ignored. Separate the fast movers (coverage, self-service adoption, leaver revocation) from the structural grinds (estate coverage, legacy integration) and give them different clocks — quarterly for the first group, annual for the second.
Instrument from systems you already run. The IdP knows every authentication event and factor. The IGA platform knows entitlements, reviews, and revocations. The HR system knows the joiner-mover-leaver events that start every lifecycle clock. Endpoint management knows device posture. A zero-trust dashboard is mostly plumbing between systems of record you already pay for; treat any metric that requires a new manual spreadsheet as a design smell.
Assign owners and a cadence. Every metric gets a named owner and a review rhythm — monthly for operations, quarterly for executives. And build in recalibration: a metric that has been green for three consecutive quarters has stopped asking a hard question and should be tightened or retired. The dashboard is a living instrument panel, not a trophy case.
One sequencing note on the executive audience specifically: report against the baseline from day one, even when the early numbers are ugly. The instinct to wait until the dashboard looks respectable is exactly backwards — an ugly baseline honestly reported is the strongest budget argument the program will ever have, and every quarter of delay is a quarter of demonstrable progress the program can never claim later.
The metrics that mislead
A reference on measurement owes you the anti-patterns, because bad metrics are worse than no metrics — they manufacture confidence.
 Deployment percentages, block counts and tool tallies flatter the program. Outcomes — risk reduction, response speed, resilience — are the honest set.
Deployment percentages. "MFA rolled out to 95% of users" measures procurement and enrollment, not protection. The attacker-relevant number is the share of authentication events that a phishing-resistant factor actually protected, including the service accounts and legacy protocols the rollout never touched.
Blocked-attack counts. Blocks rise with attack volume, not defensive quality. A quarter with a big phishing campaign produces a heroic-looking number that says nothing about whether the campaign would have succeeded. Trend lines on conditions — standing access, coverage, revocation speed — describe defense; block counts describe weather.
Tool tallies and framework checklists. Counting deployed capabilities against a pillar checklist produces a maturity theater score. The estate can check every box and still extend standing trust everywhere the checklist did not look — which is why the coverage metric (what fraction of the estate the control plane actually governs) has to ride alongside every capability claim.
Averages that hide distributions. Average time-to-revoke conceals the one system that takes three weeks. Average maturity conceals the ungoverned subsidiary. For risk metrics, report the tail — the p95, the worst system, the oldest standing grant — because the tail is where the incident will start.
What Avatier ships toward this pattern
Avatier's position on measurement is the same as its position on governance generally: the numbers have to fall out of operations, not be assembled for the meeting. Avatier Identity Anywhere instruments the identity domain as a byproduct of running it — lifecycle automation timestamps every joiner-mover-leaver event so time-to-revoke is a query rather than an investigation; access certification campaigns track revocation yield, not just completion; self-service requests and approvals leave a policy-checked evidence trail; and standing-privilege and entitlement analytics make the blast-radius trend line continuously observable instead of annually estimated. For the authentication-coverage metrics, the platform's MFA integration and passwordless support — including FIDO2-compatible deployment patterns for deviceless and shared-workstation segments — are built to move the honest denominator, not the enrolled-user one.
Avatier also publishes its own numbers the way this piece recommends you publish yours: the compliance posture is public at the Avatier Trust Center — SOC 2 Type II audited with zero exceptions noted, ISO/IEC 27001:2022 certified, PCI DSS v4.0.1 compliant, CSA STAR Level 1 attestation, NIST 800-53 Rev. 5 aligned, and a CISA Secure-by-Design Pledge signatory. Evidence-first is not advice we only give to other people.
What the metrics do not capture
An honest measurement reference ends by naming its own blind spots.
Metrics do not capture the assumption you never tested. Every dashboard measures the risks someone thought to instrument; the intrusion that hurts usually travels through the path nobody baselined — the acquired company's stack, the vendor's access, the break-glass account excluded from the JIT rollout for good reasons that nobody revisited.
They do not capture control quality, only control presence. Time-to-revoke can be four minutes and the revocation incomplete; MFA coverage can be total and the factor phishable; a segmentation metric can be green while the policy allows far more than anyone remembers approving. Periodic adversarial testing — red teams, purple teams, assumed-breach exercises — is the audit that keeps the instruments honest, and no metric replaces it.
They do not capture culture. A workforce that routes around governed access paths because the governed path is slow will make every coverage metric quietly wrong, and the workaround will not appear on any dashboard until it appears in an incident report.
And they do not make decisions. A metric is an instrument reading; the program still needs pilots willing to act on it — to retire the standing accounts the trend line says should already be gone, to fund the legacy integration the coverage metric keeps flagging, to tighten the target that has been comfortably green for a year. Enterprises that run the loop — baseline, instrument, act, recalibrate — get the two best outcomes zero trust has to offer: intrusions that stay small, and audits that stay boring. The metrics are how you prove you are getting both.
ABOUT THE AUTHOR

More from IAM & Identity Governance
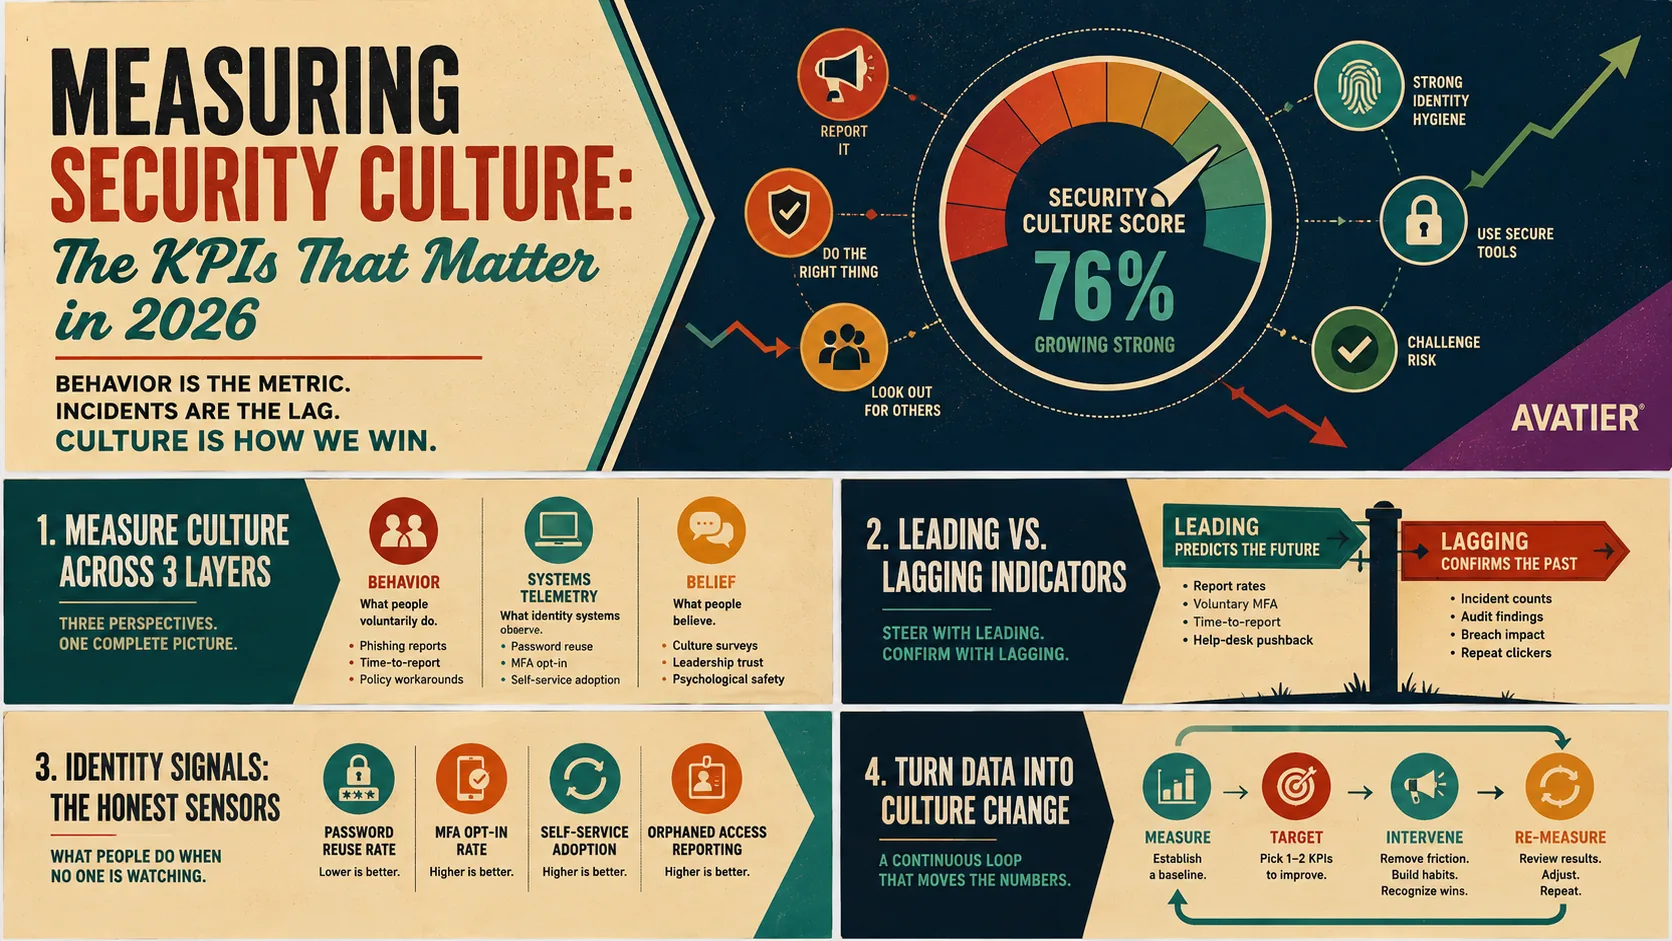
Measuring Security Culture: The KPIs That Matter in 2026
How organizations measure and improve security culture in 2026: leading vs. lagging indicators, behavioral KPIs, identity hygiene signals, survey instruments, and how to actually move the numbers.
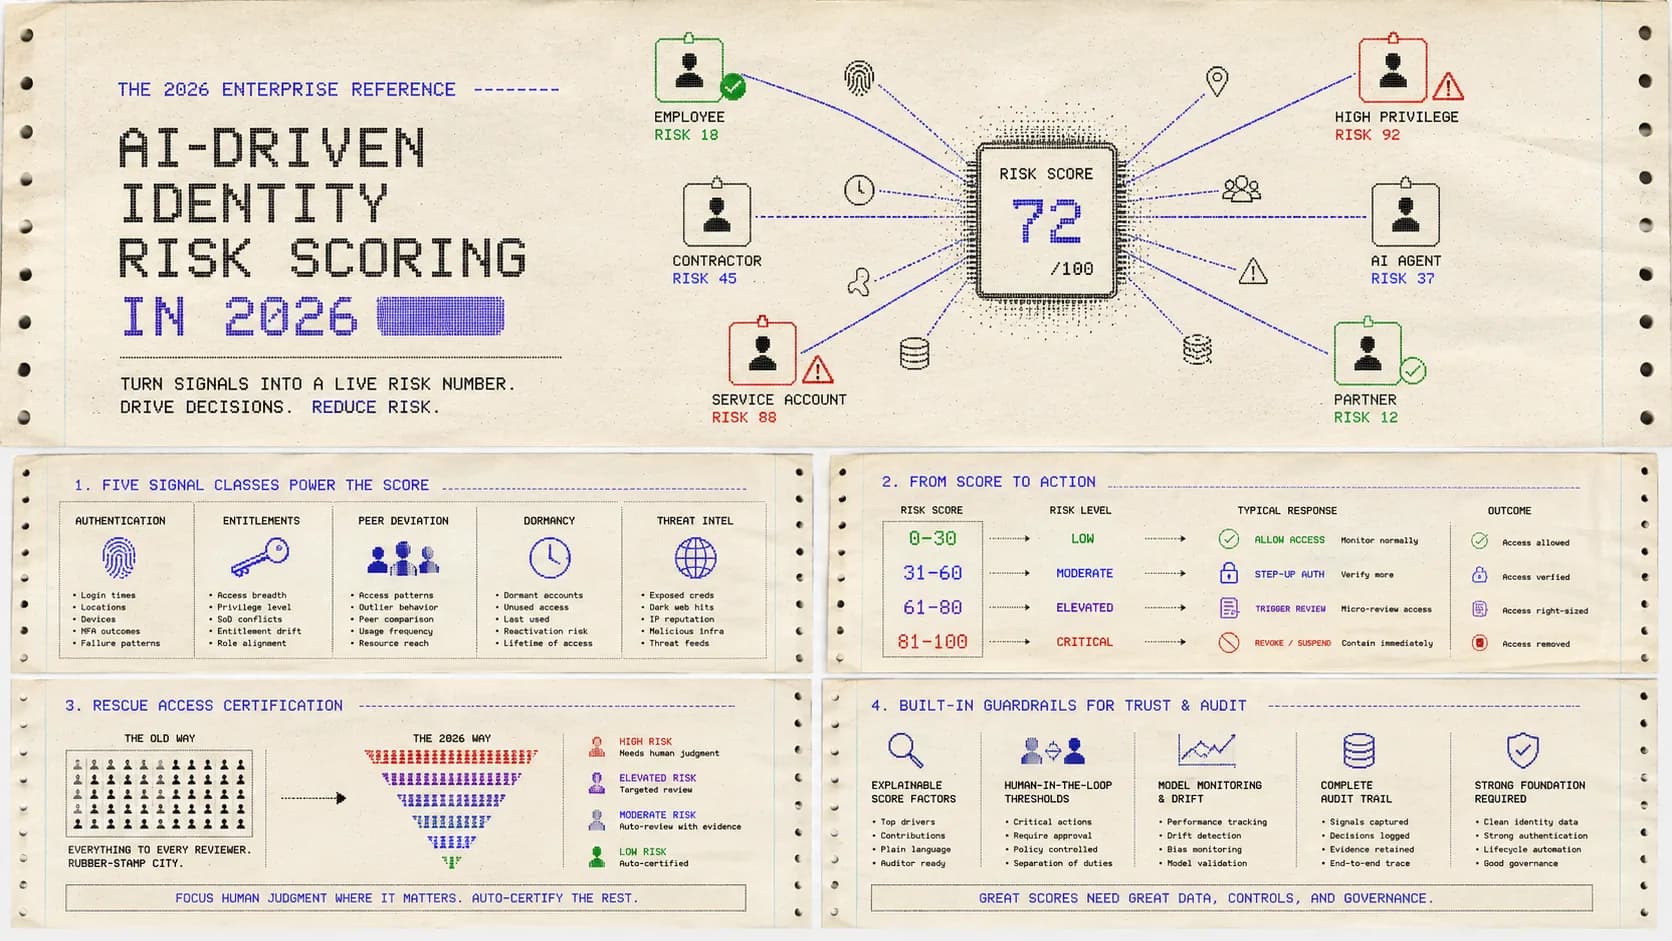
AI-Driven Identity Risk Scoring in 2026: The Enterprise Reference
AI-driven identity risk scoring turns authentication, entitlement, and behavior signals into a live per-identity risk number that drives step-up auth, reviews, and revocation. The 2026 reference.

Human Error in Data Breaches: What the Numbers Really Say (2026)
There is no single authoritative percentage for human error in breaches — the honest answer is directional: most breaches involve a human element, and the exact figure depends on who is counting and what they count.